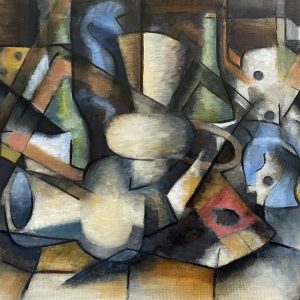
And I was right. And I wish that I had thought about doing this sooner.
I dusted off my printing box and experimented with printing a line drawing. I used an A3 piece of soft cut Lino as I didn’t want to be shooting off all over the place, and have bits crumbling away. I used my smallest tool. The good thing about soft cut is that you can easily use a craft knife to cut out sections.
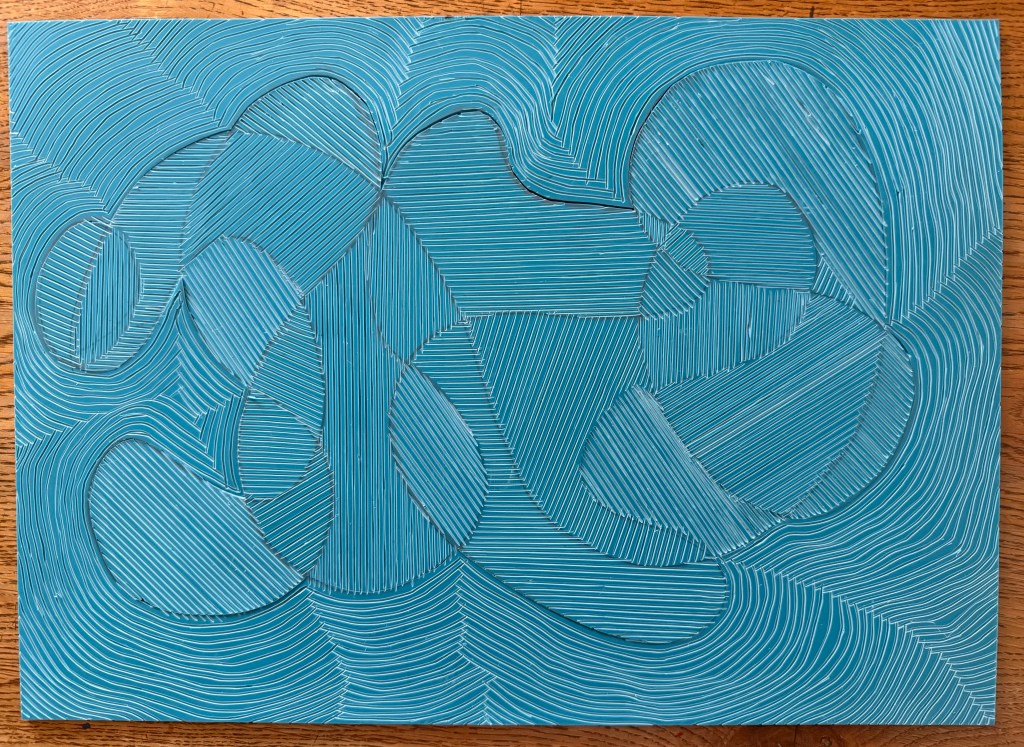
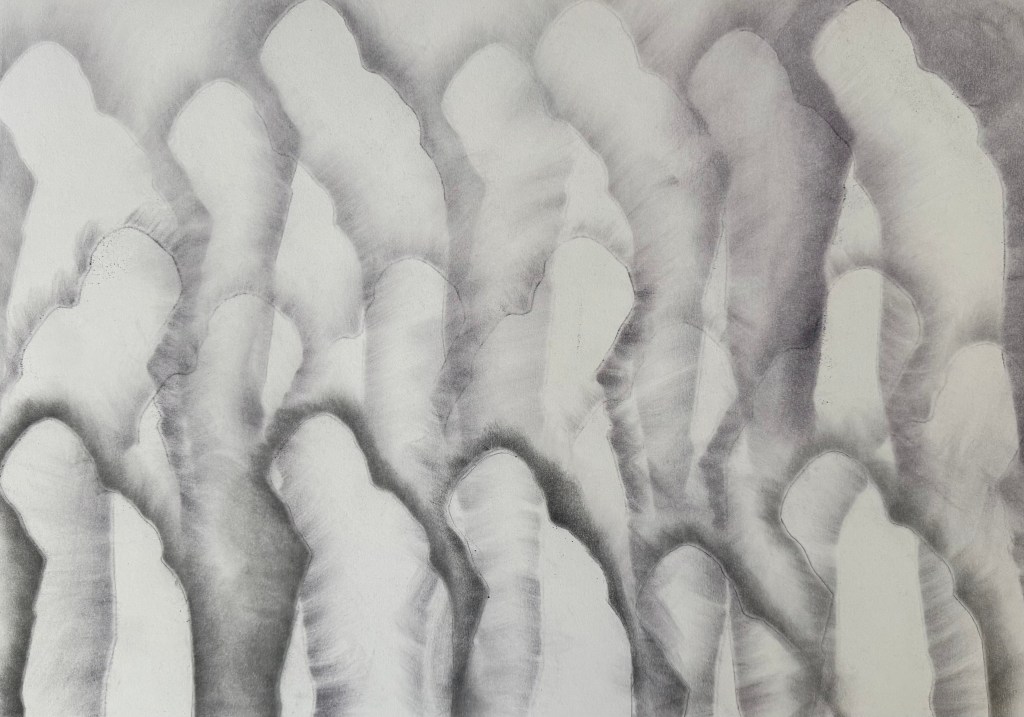
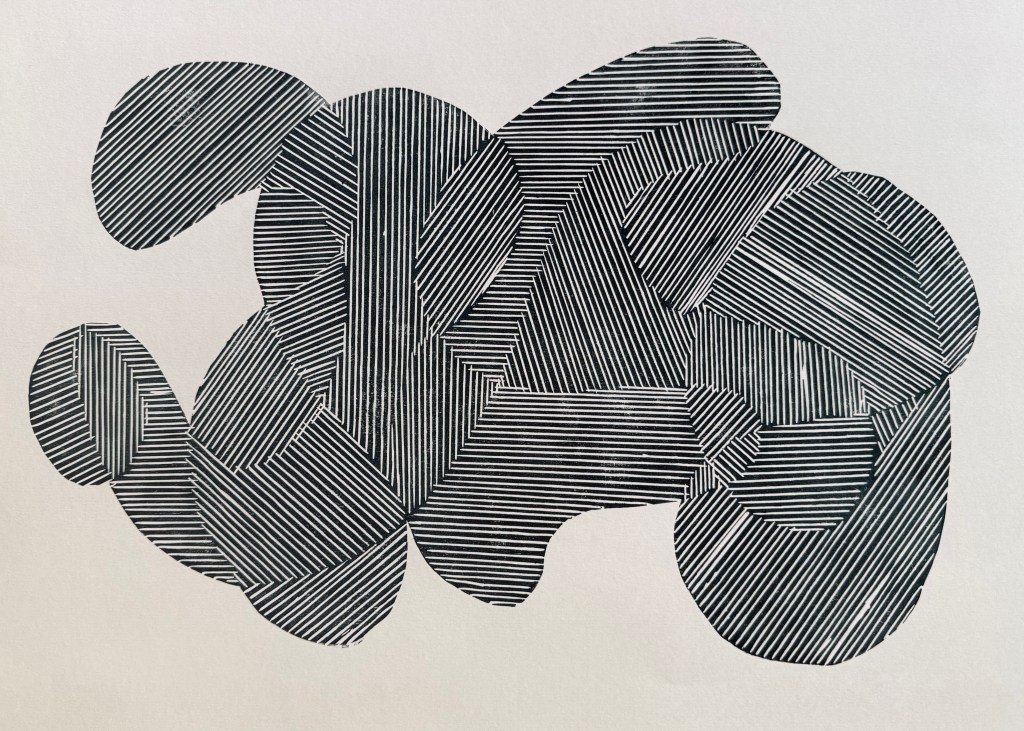
I started by tinting black with some blue, and printing the whole block:
I like.
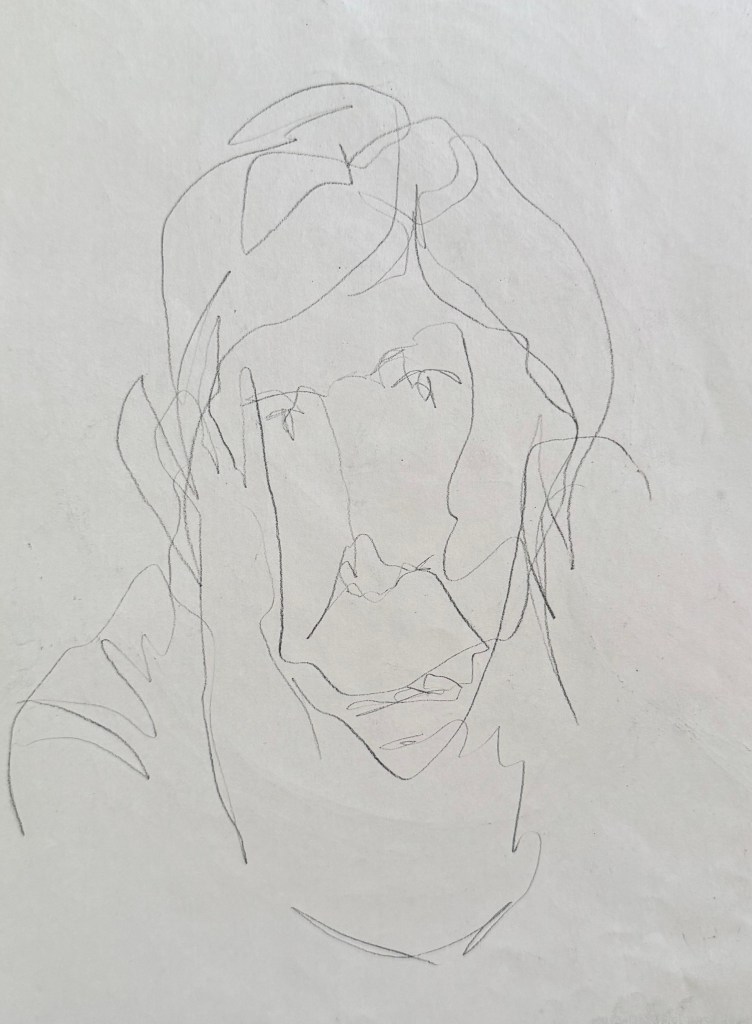
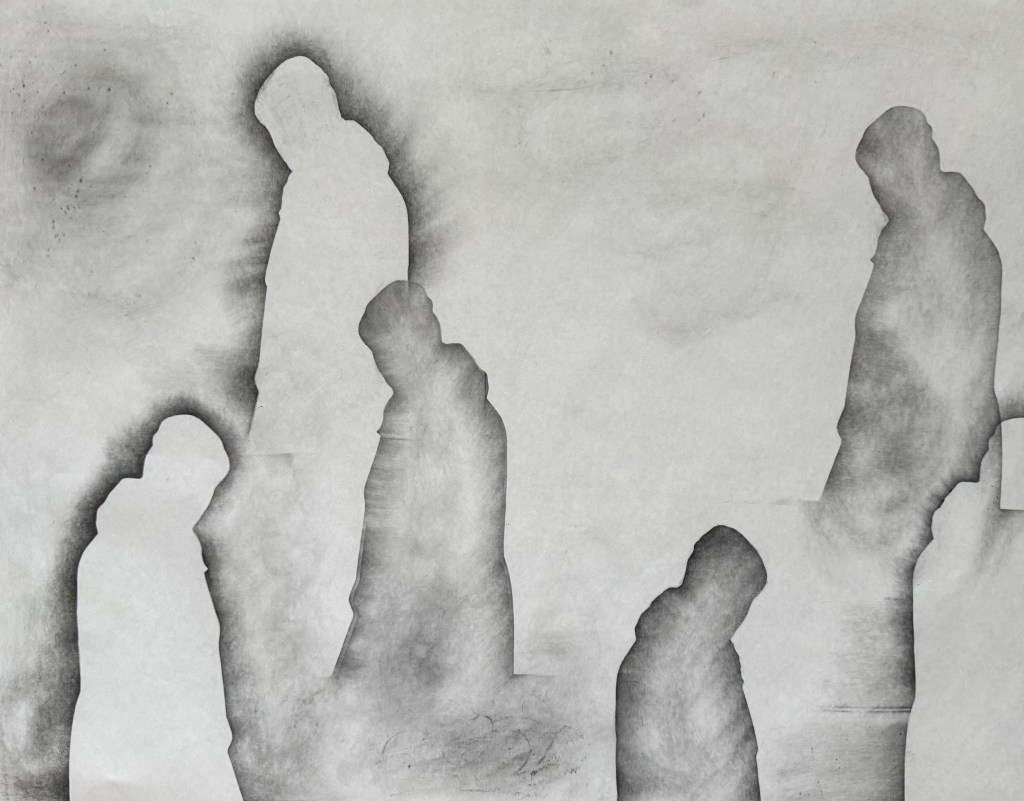
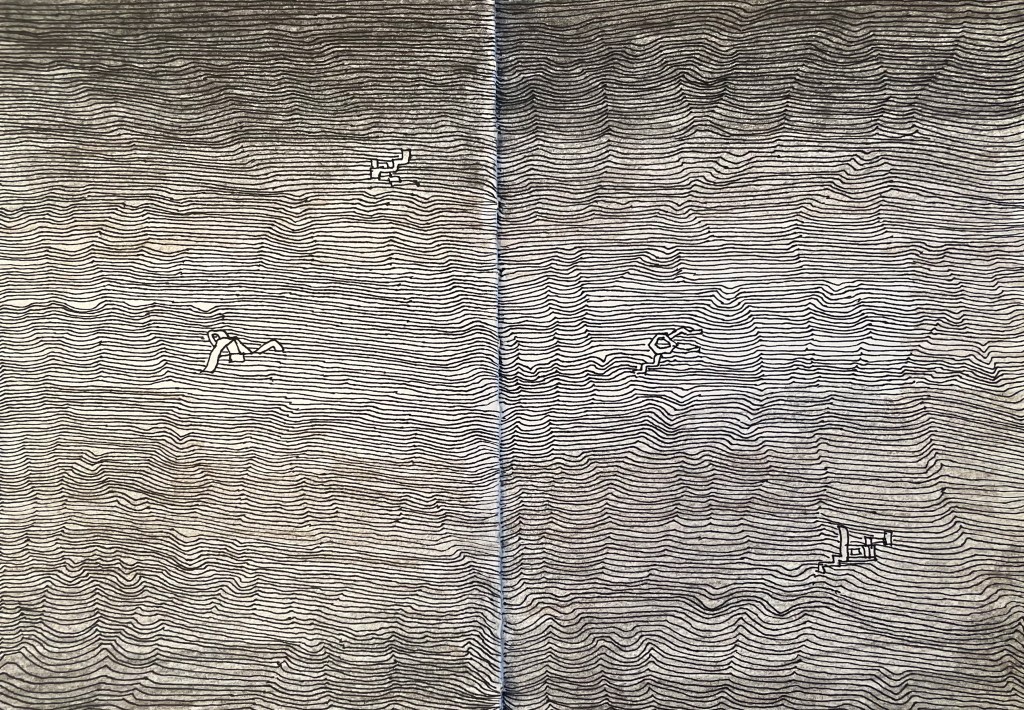
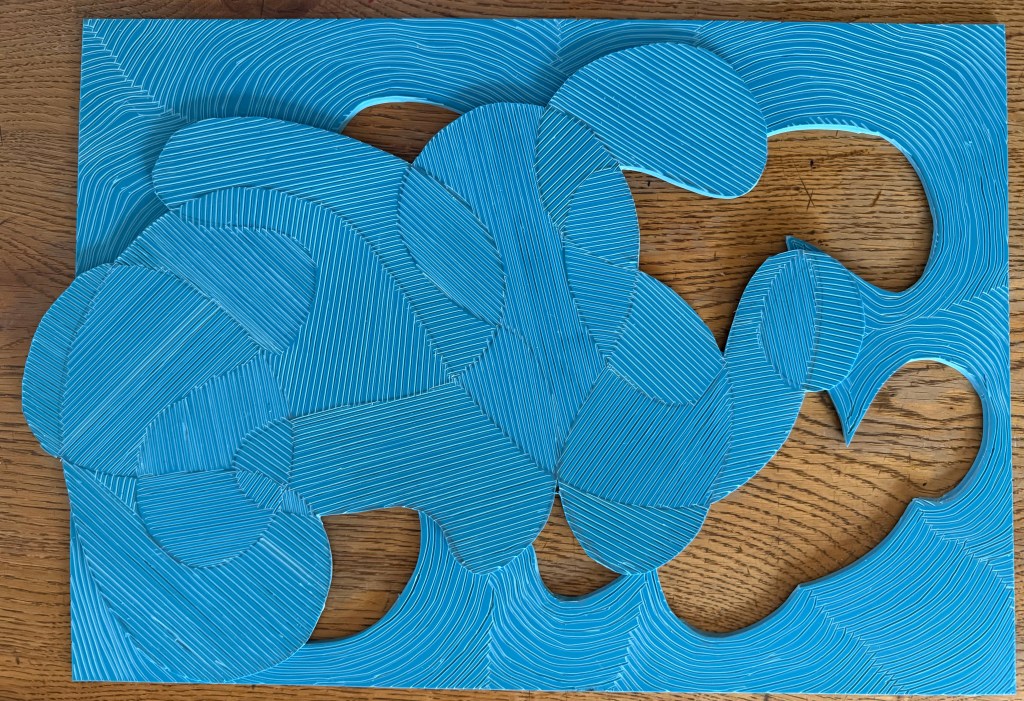
Then the two separate sections:
I also like. This way around, it reminds me of a figure, curled up, cowering, face protected by hands.
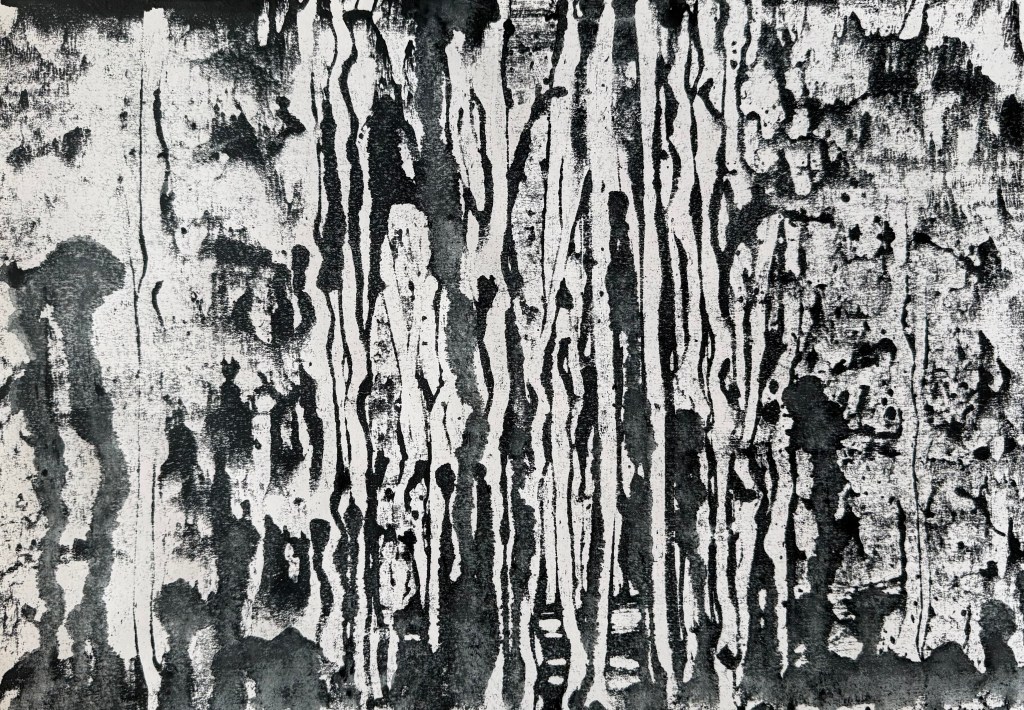
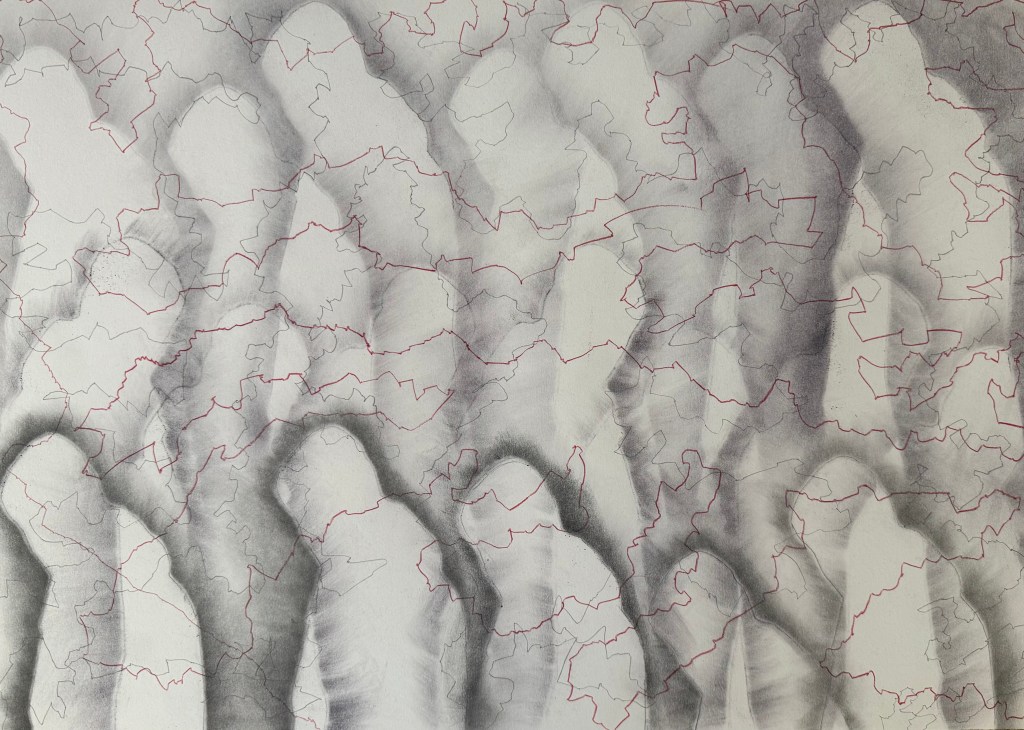
Then I added in some extender to make a lighter, more transparent colour:
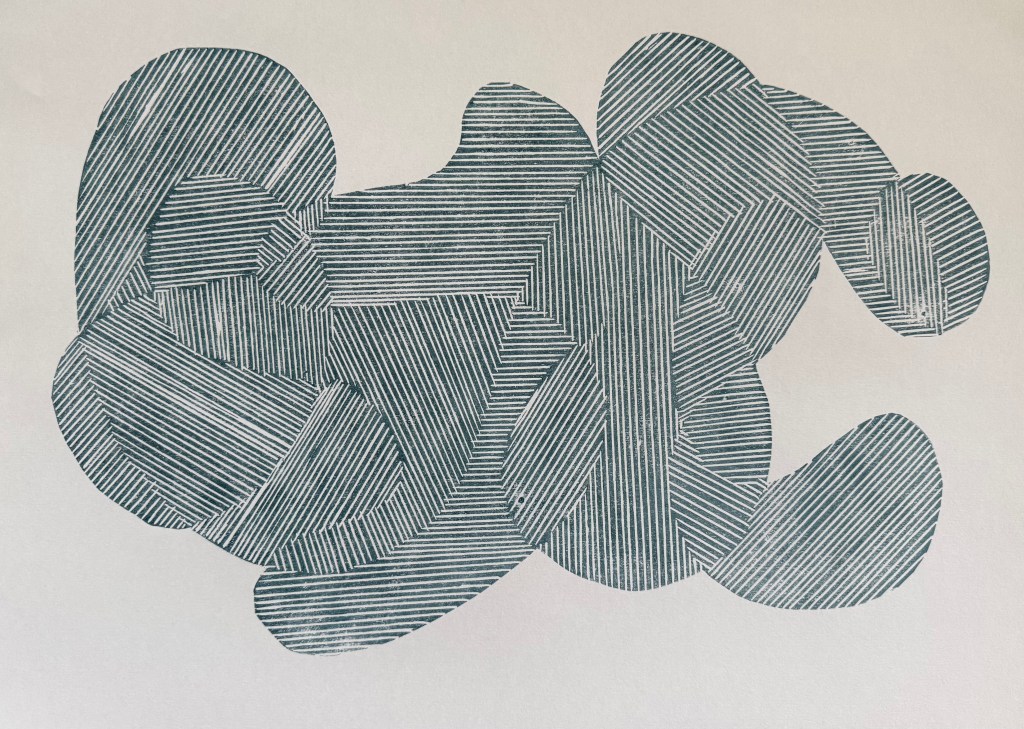
Nice.
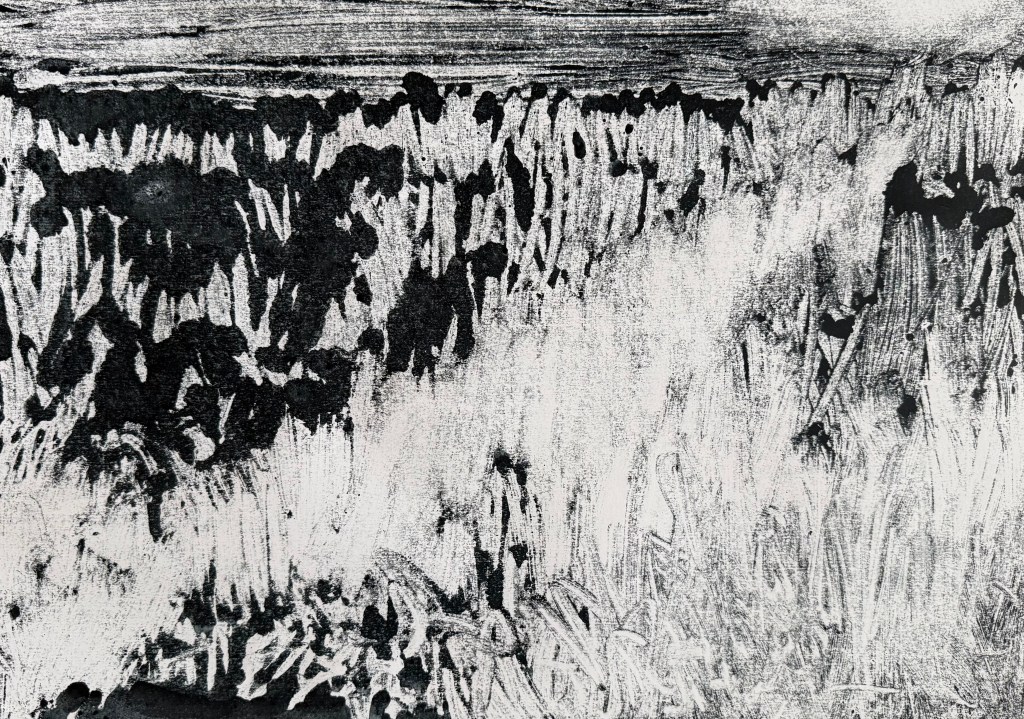
Printing on tracing paper:
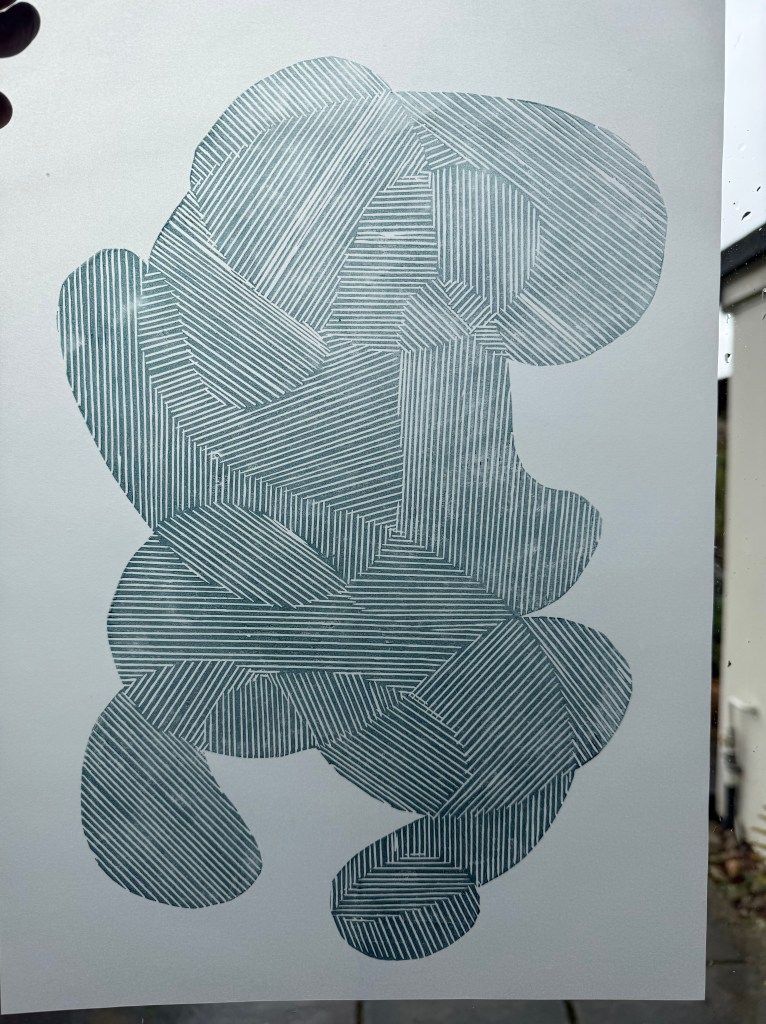
Interesting. Possibilities.
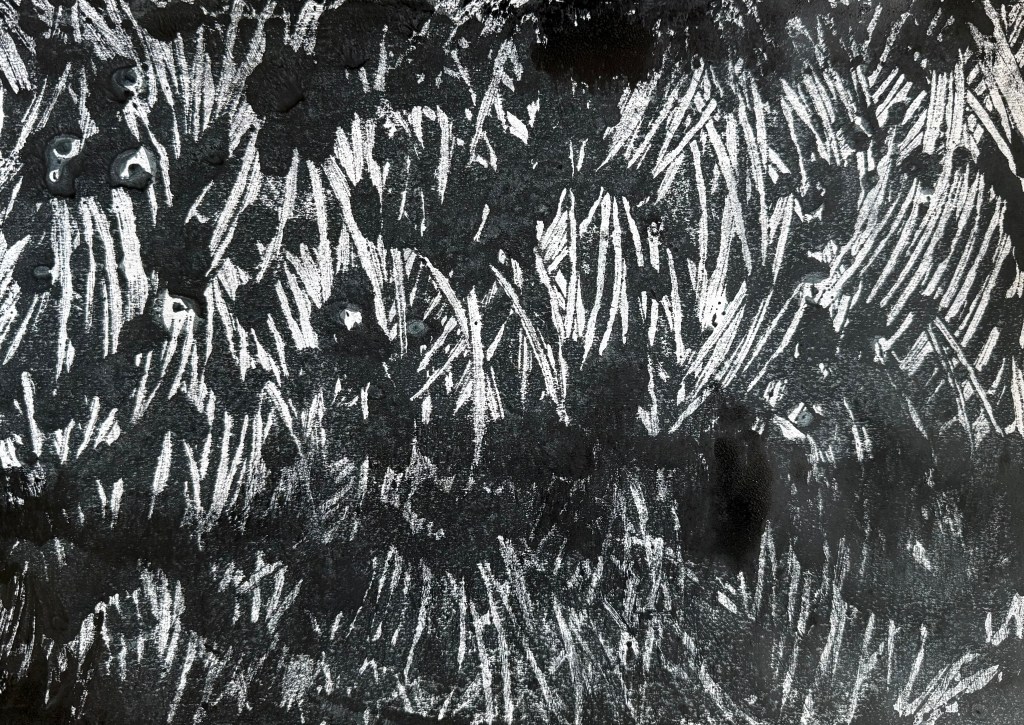
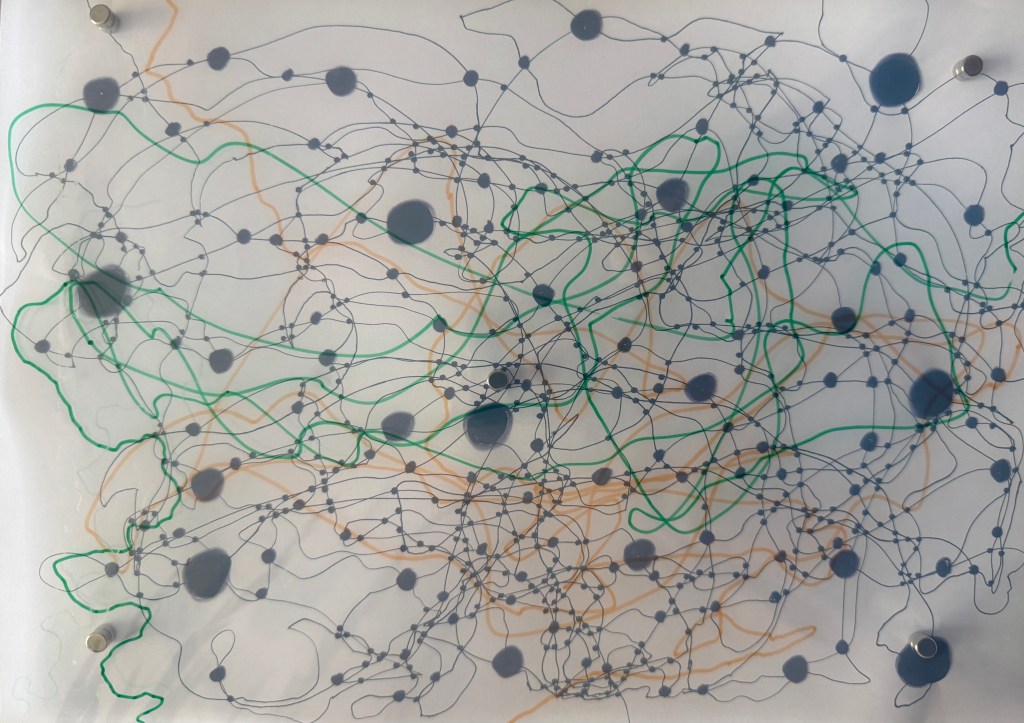
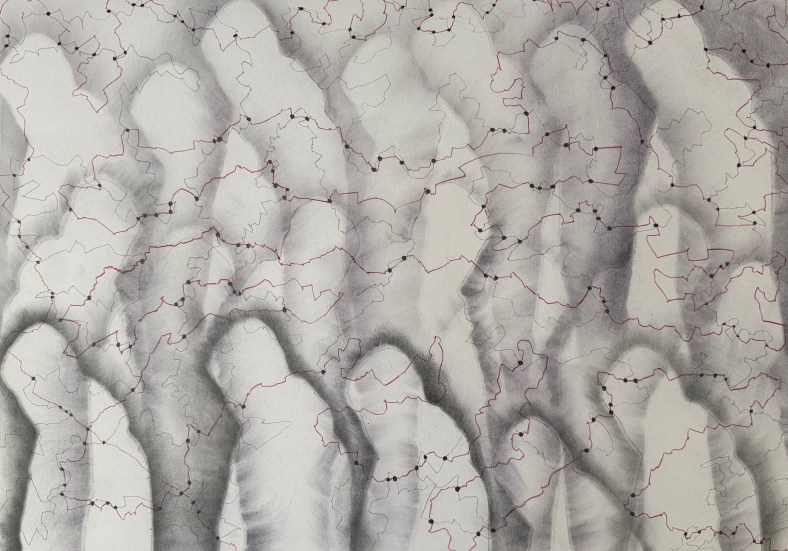
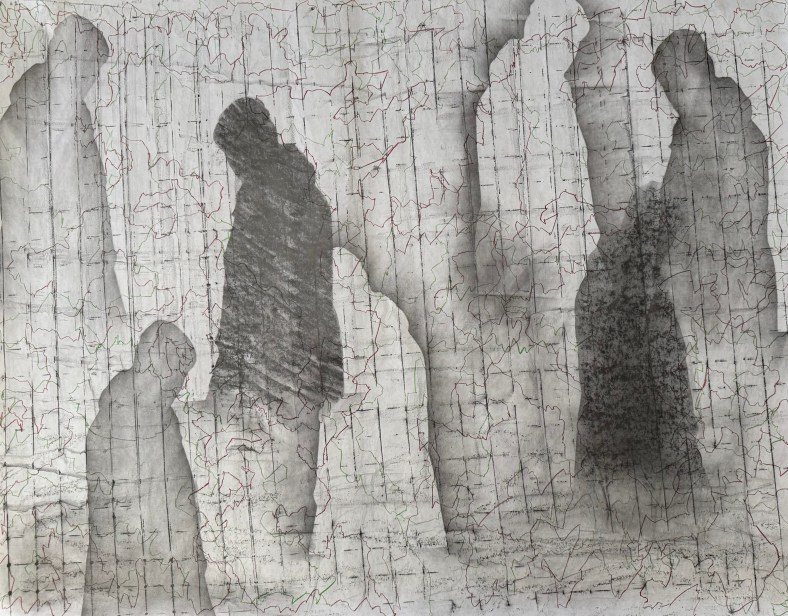
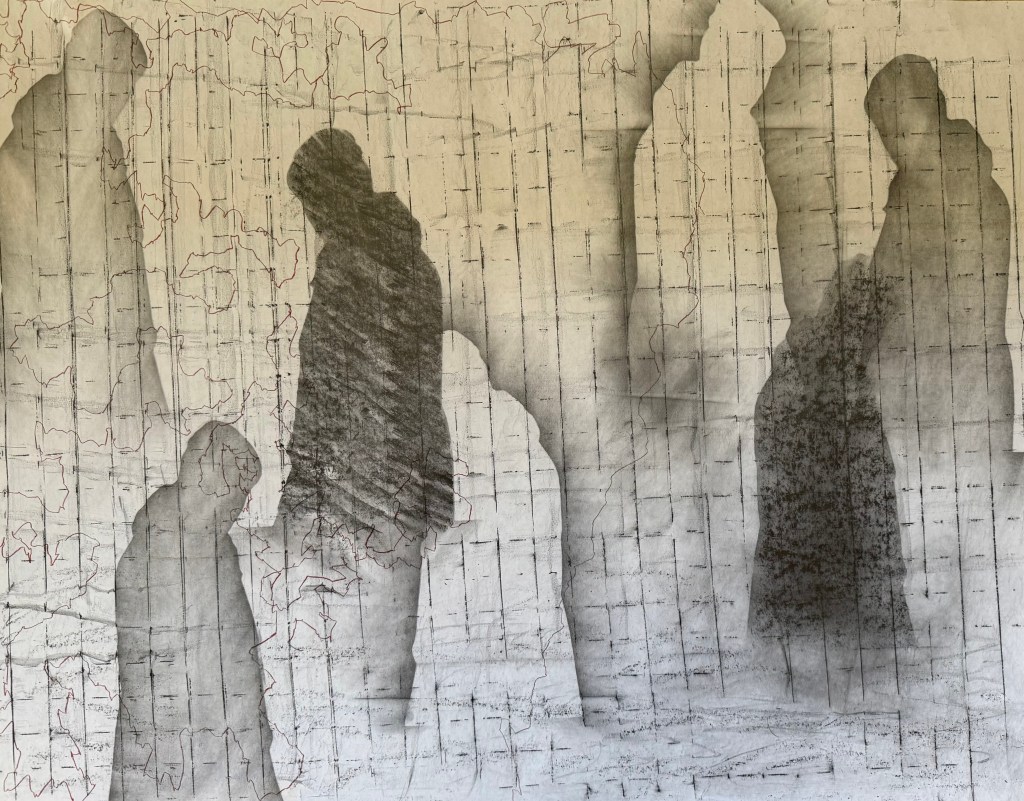
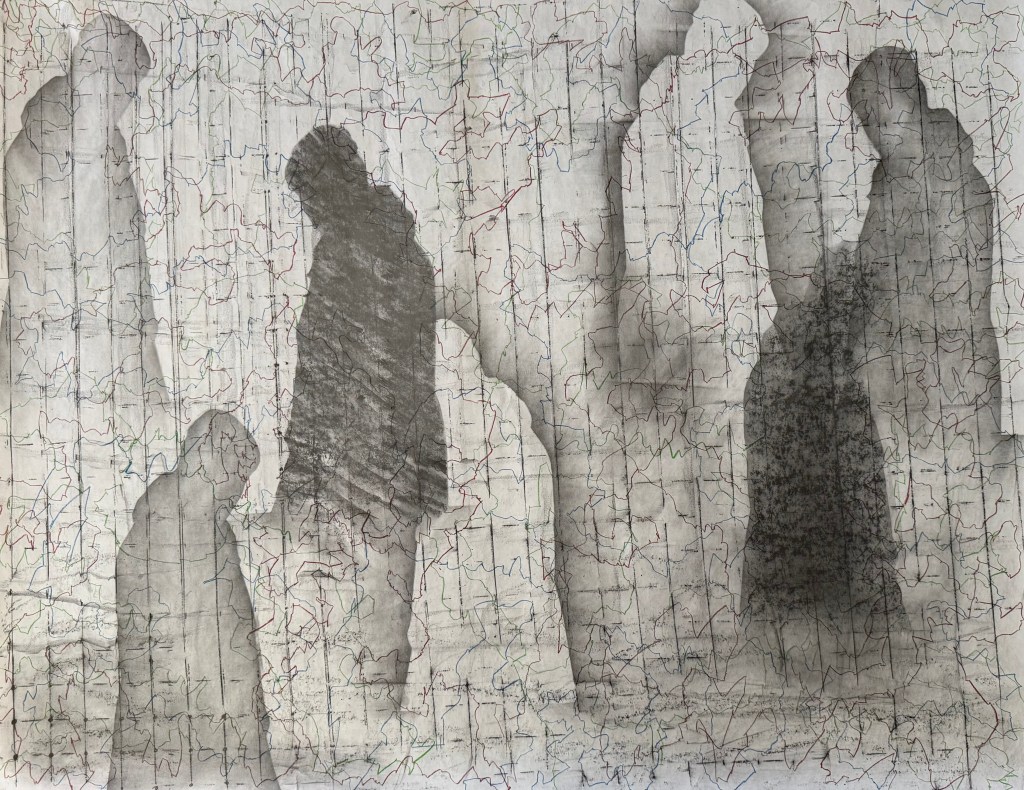
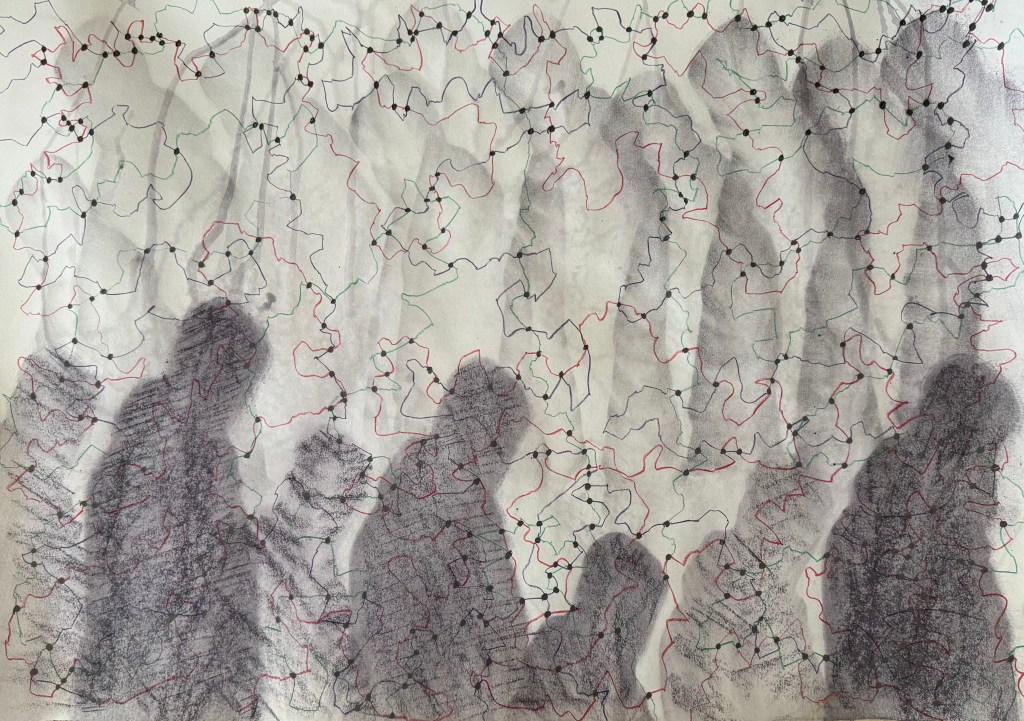
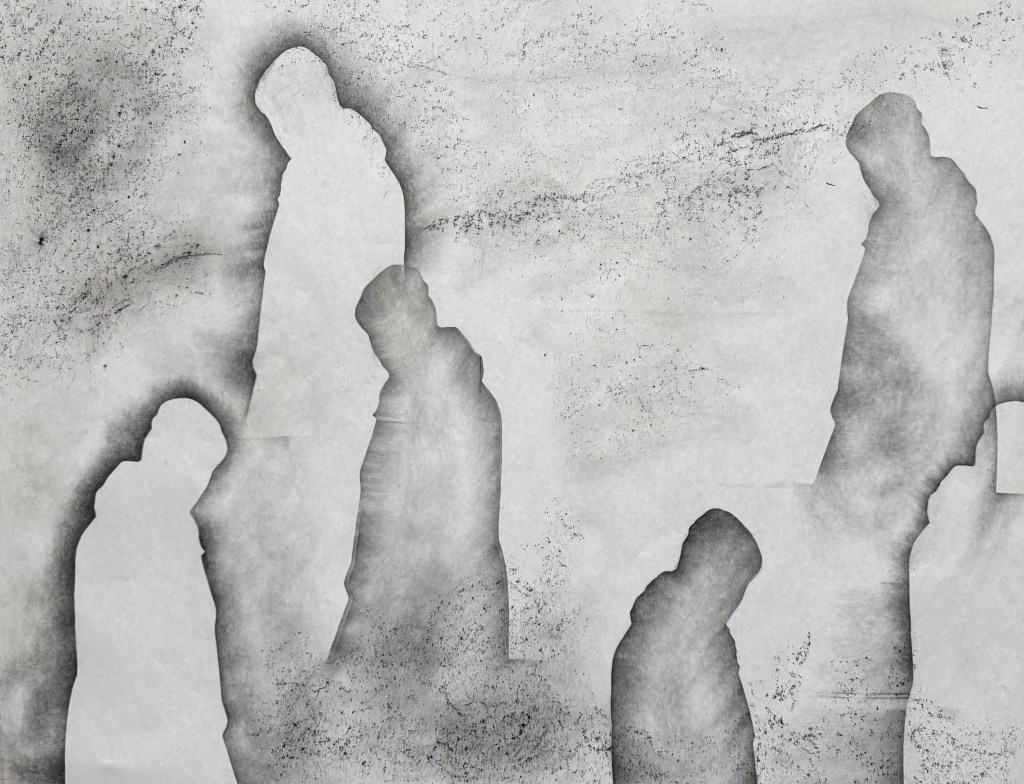
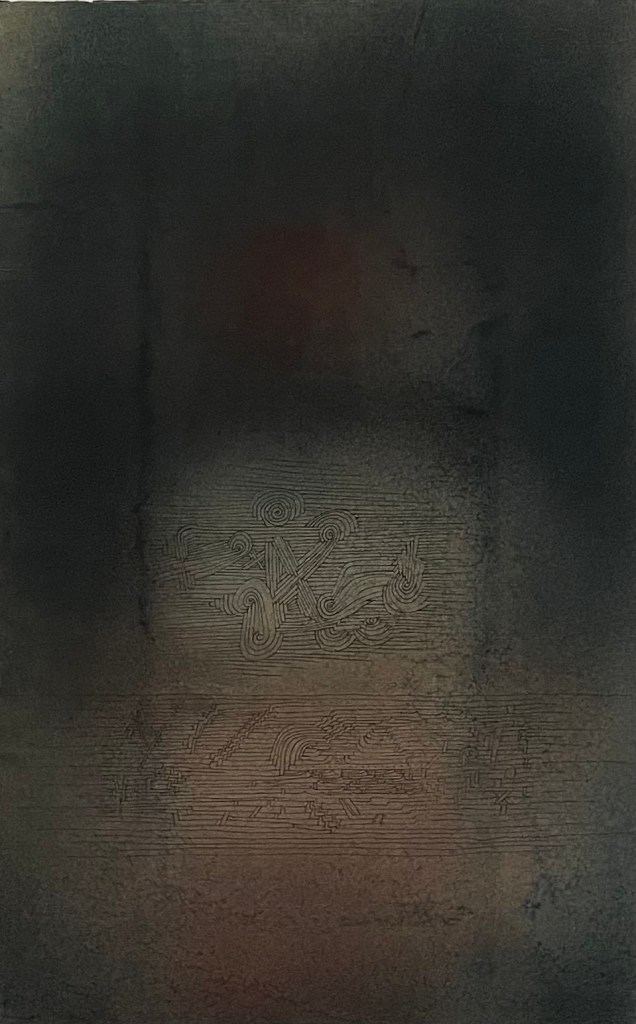
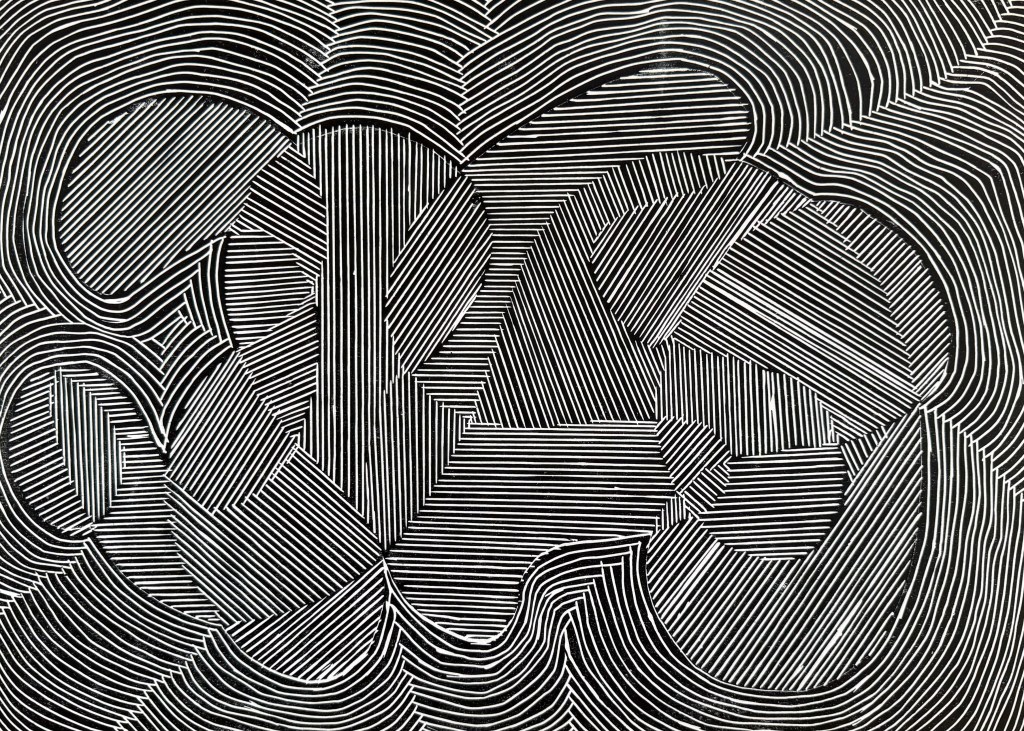
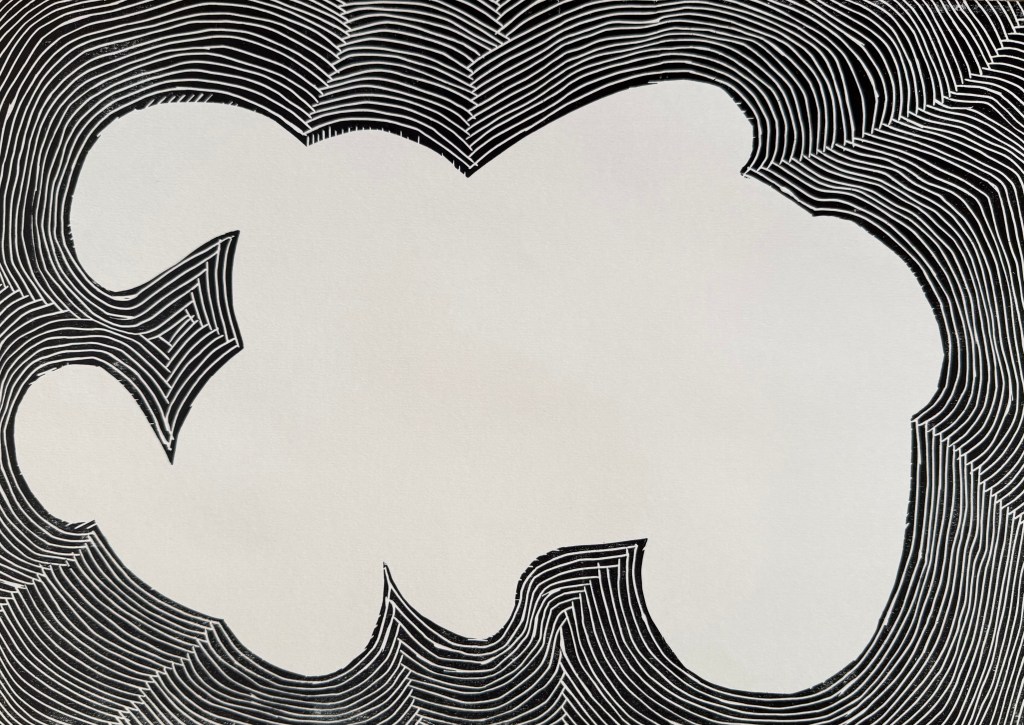
I then experimented with overprinting:
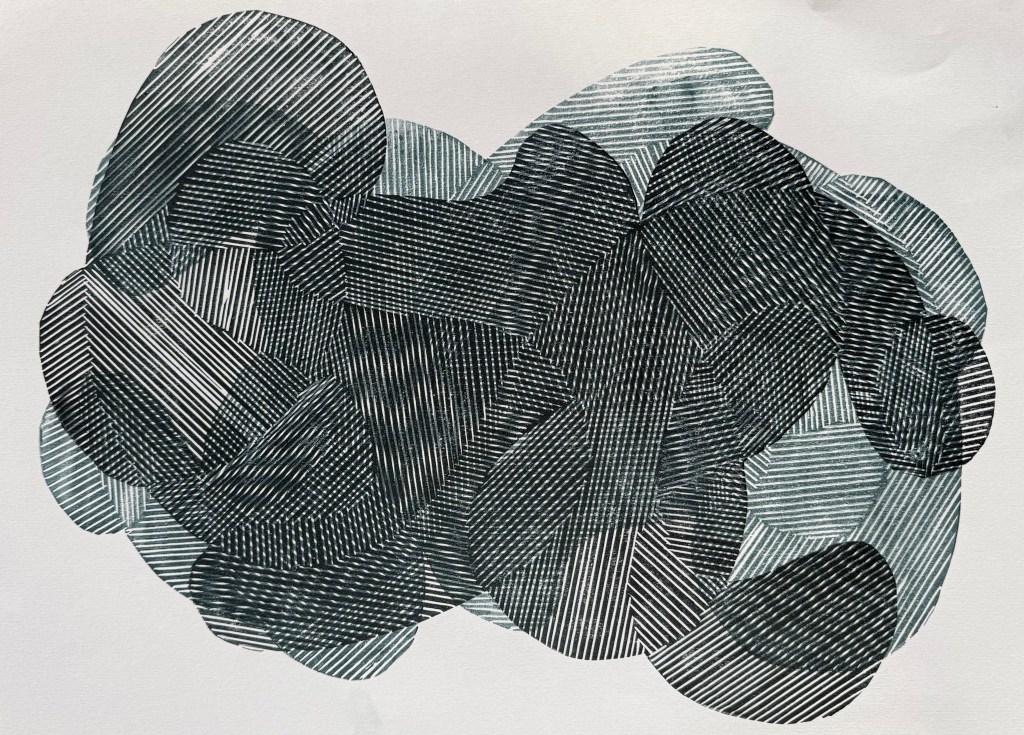
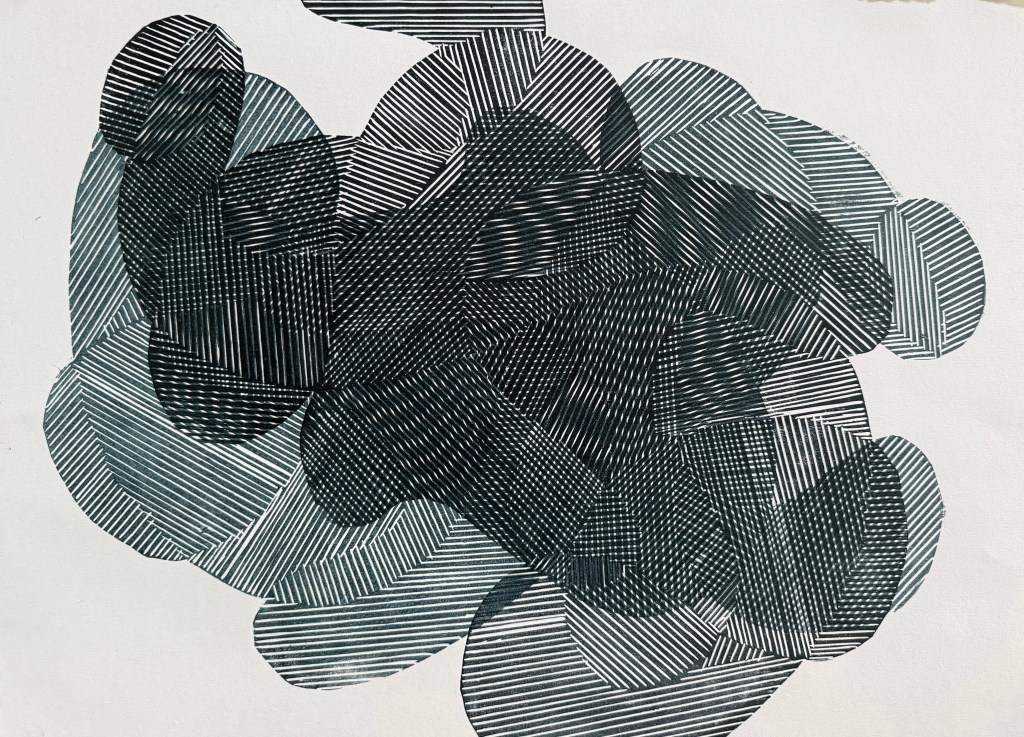
Absolutely love.
I’ve noticed that I’ve been using that word a lot more recently.
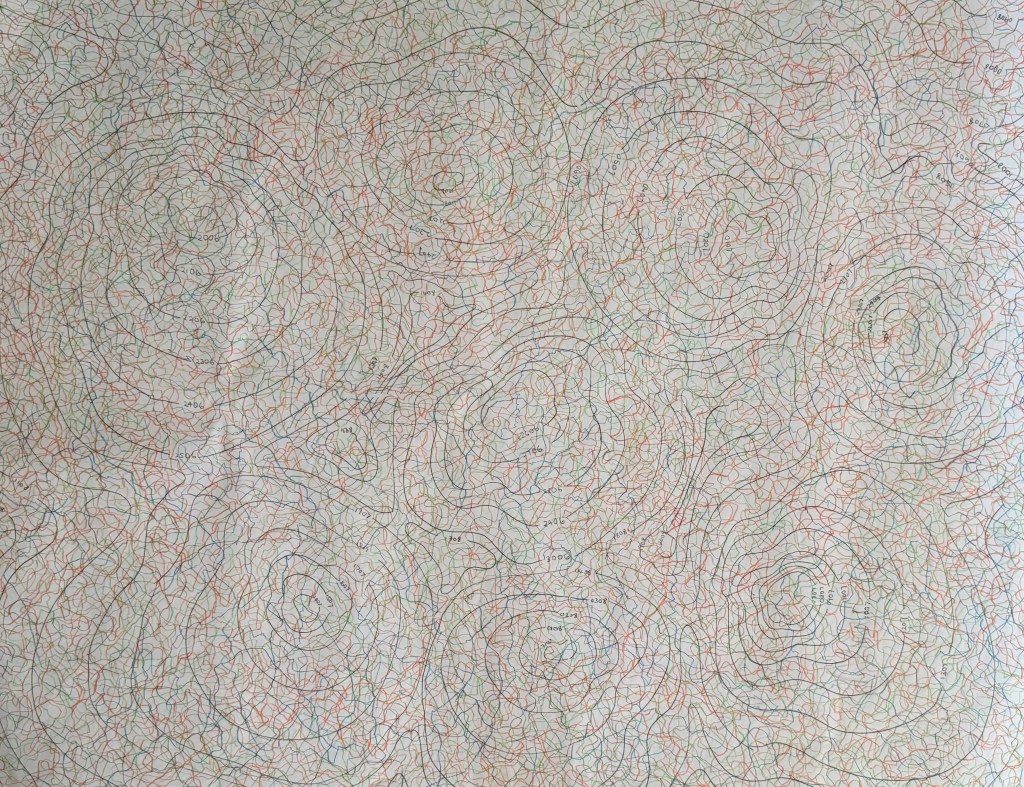
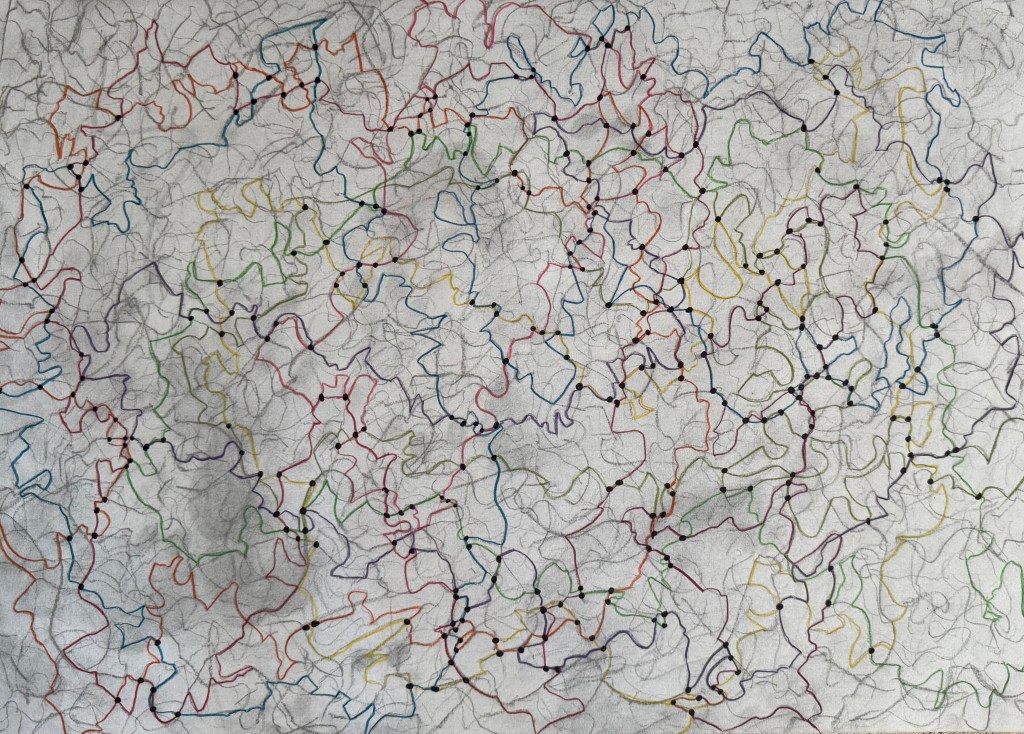
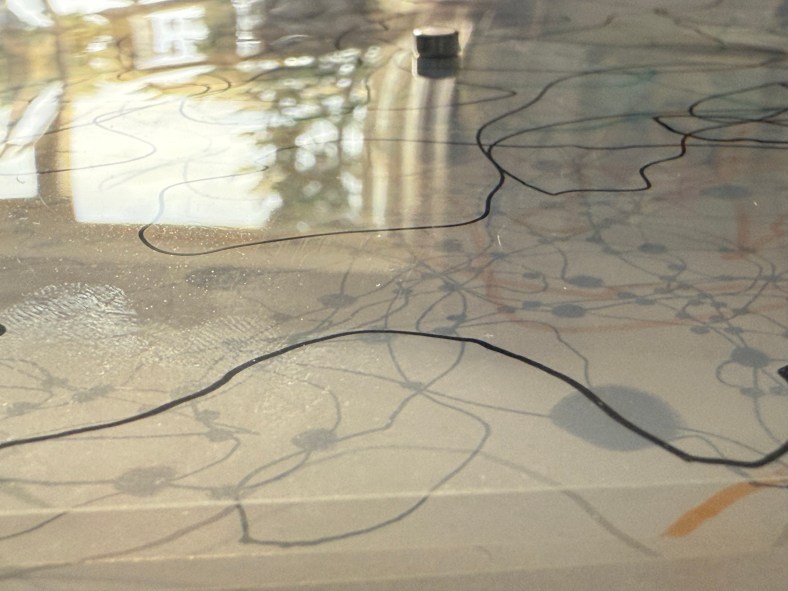
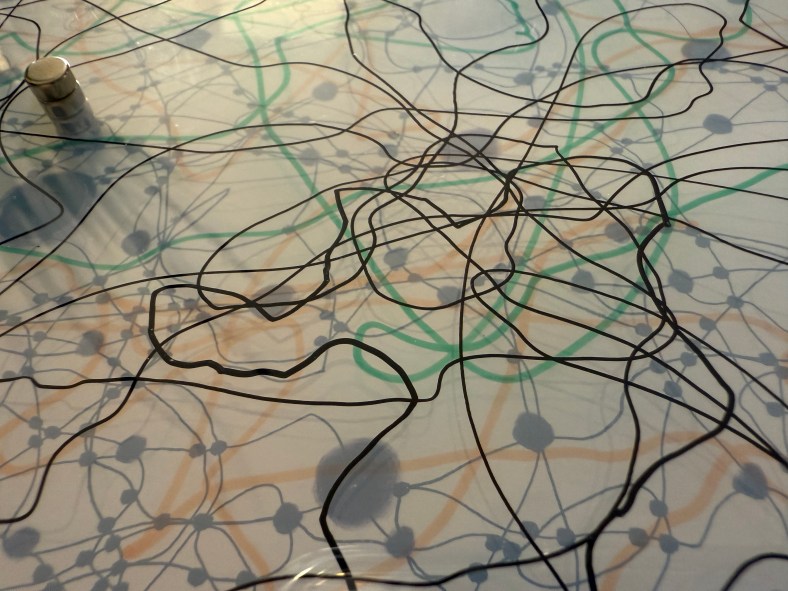
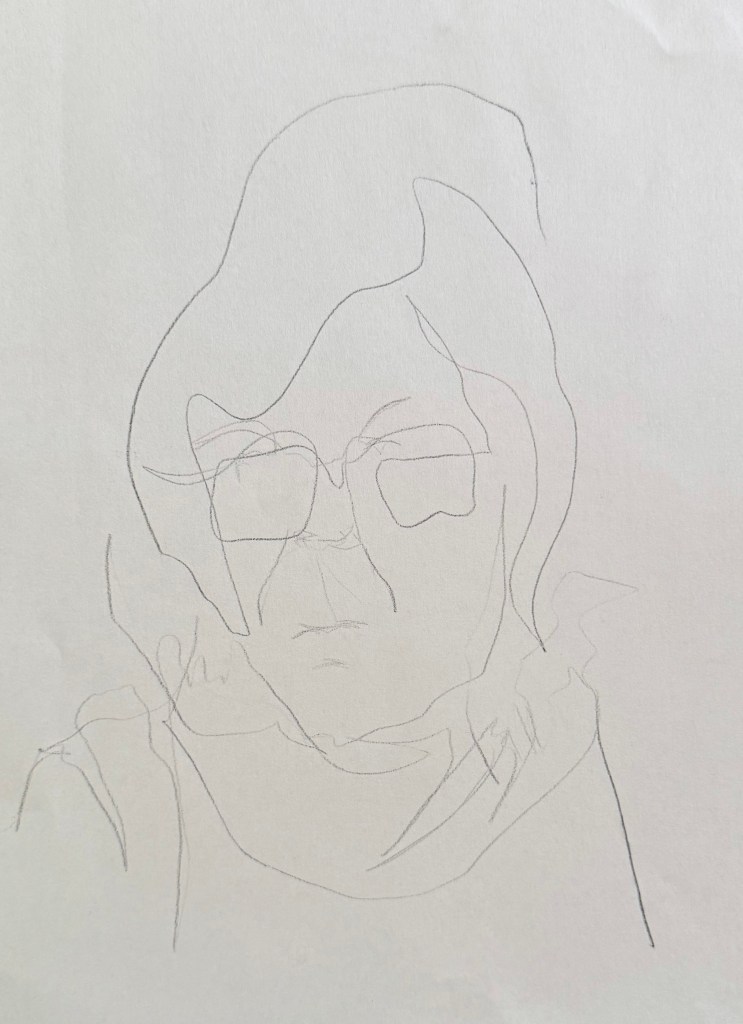
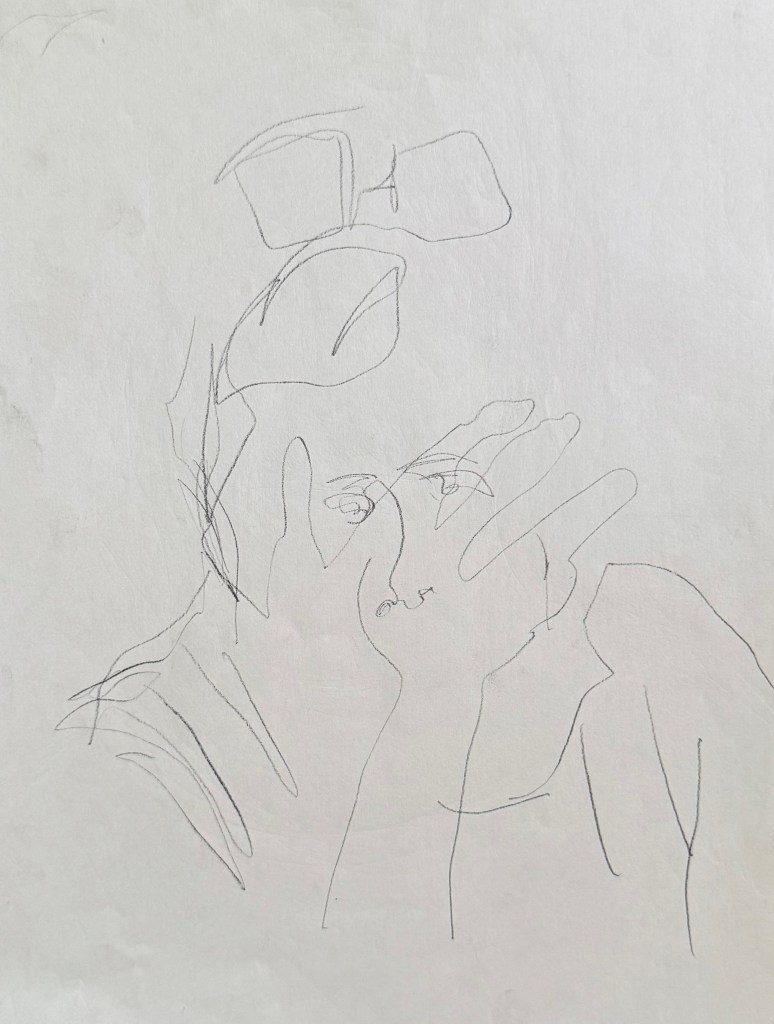
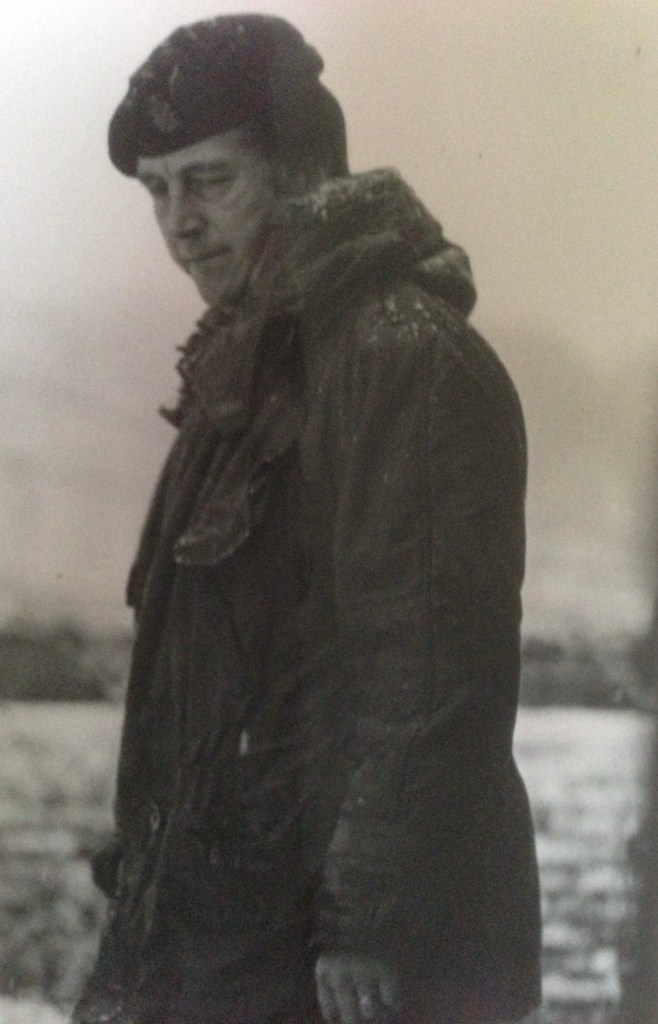
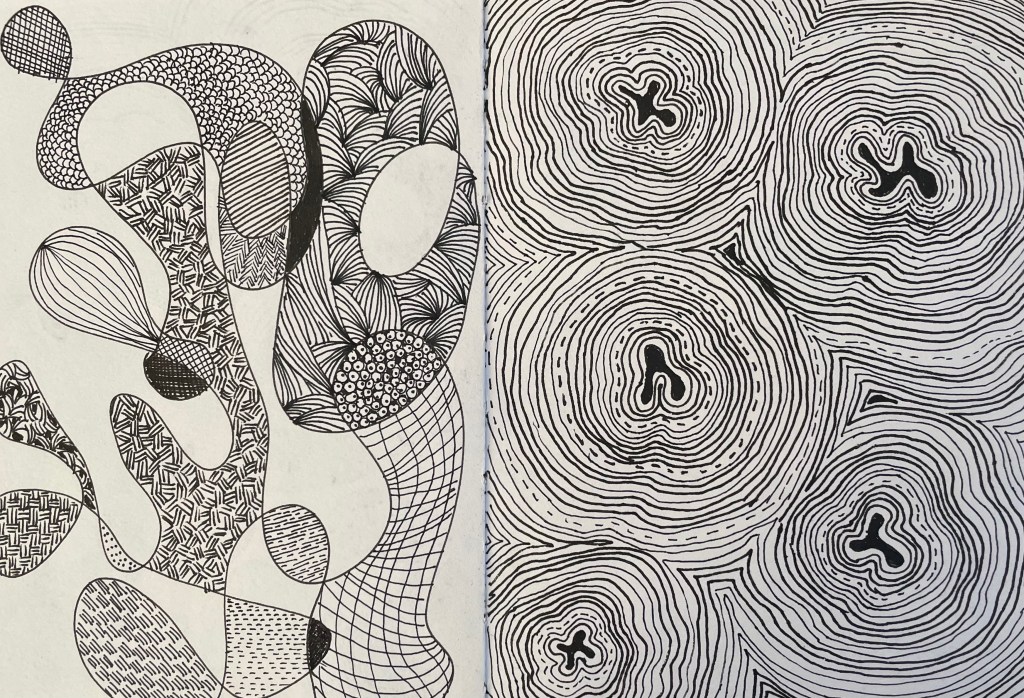
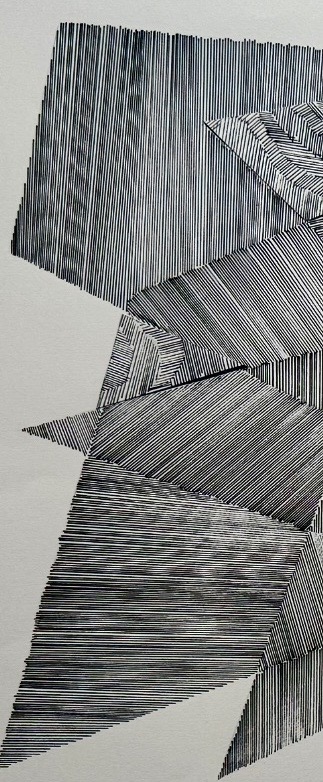
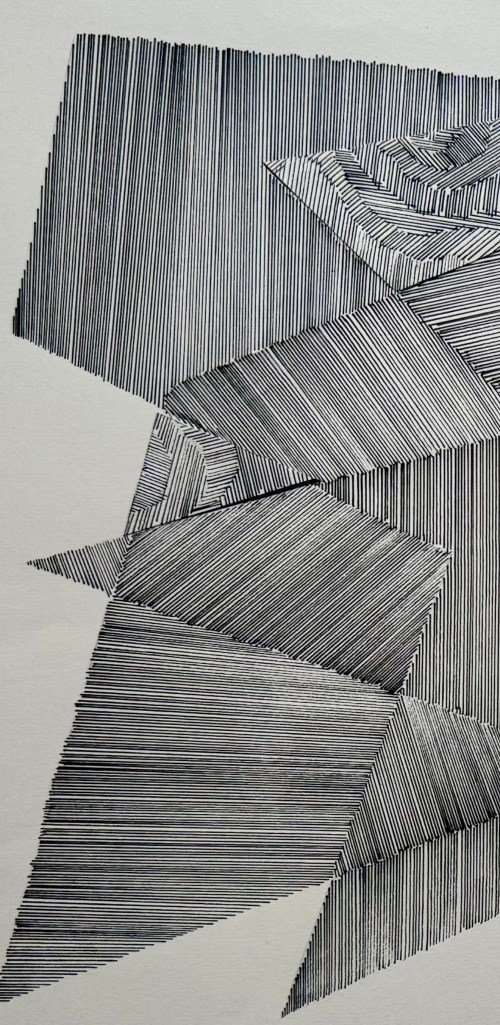
It’s fascinating that by overlapping the prints I’ve recreated some of the mark-making I was experimenting with using the Micron pens (Pushing Paper III) and also the strange effects created when I photographed the pen drawings. It was almost as if the camera couldn’t quite work out what was going on. For example, when the image is displayed on my phone normally it looks like the first image below. It is only when I zoom in, that I can see that the lines look as they do in the second image.
Anyway, I think that it was a very productive session and has given me lots to thinks about. I’ve decided that I’m warming to linocut. It used to bug me before, because it can be quite patchy in places (probably my ineptitude), but since using the fineliners to make line drawings, and noticing the texture created when the ink dried up a bit and the effect of mistakes, I’ve noticed that Lino has the same qualities. They both evidence the process of making which I’ve recently been embracing, rather than a perfect print.
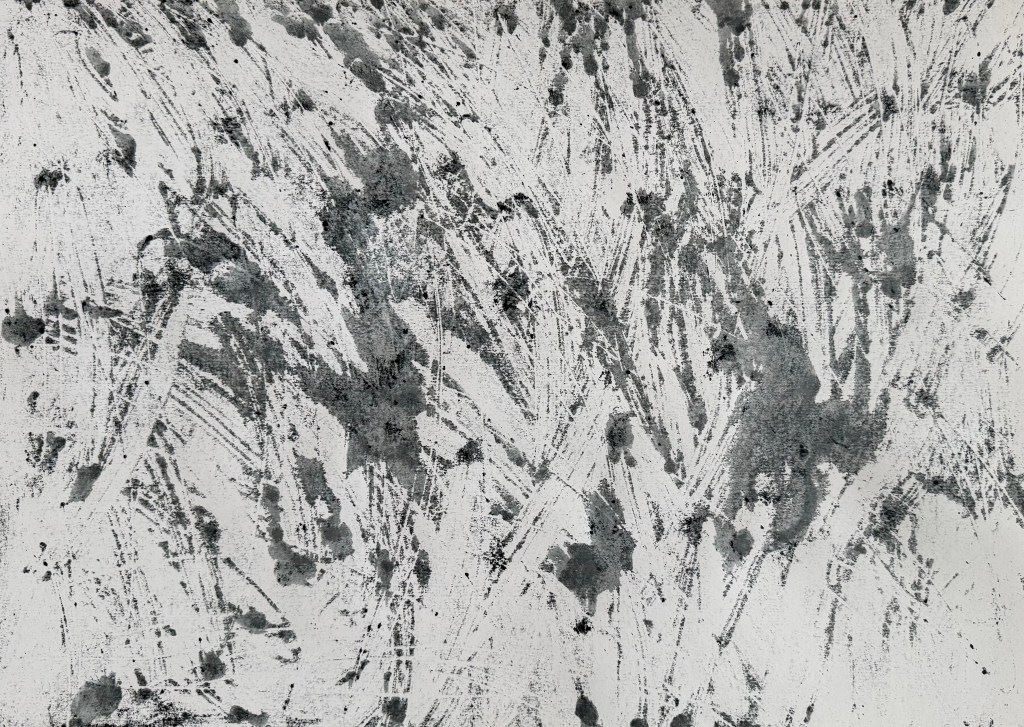
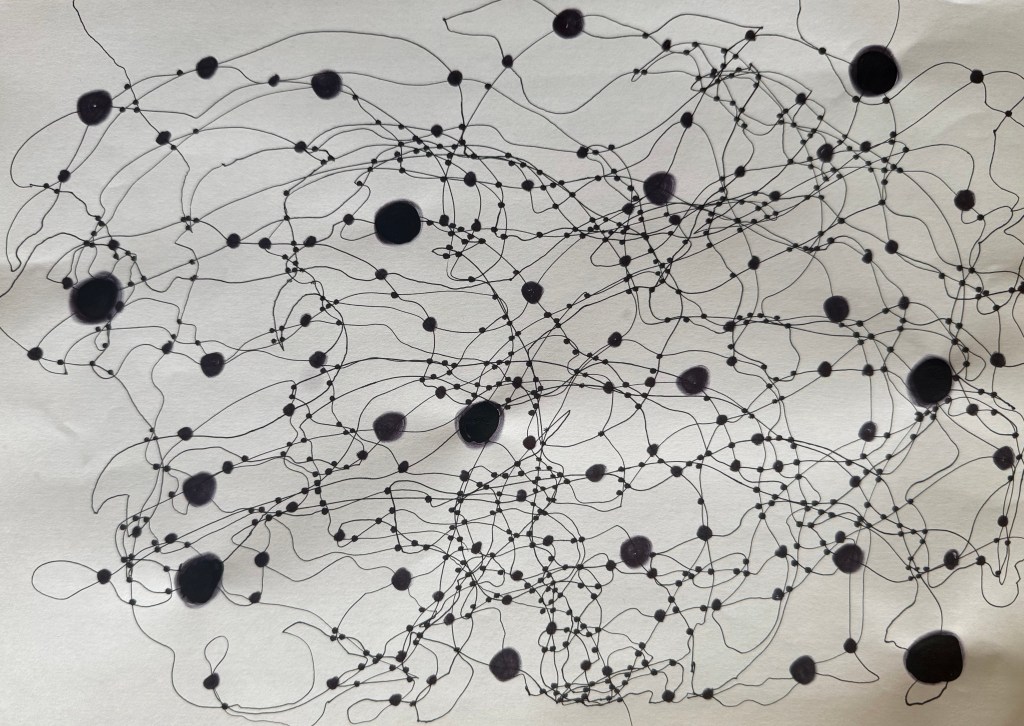
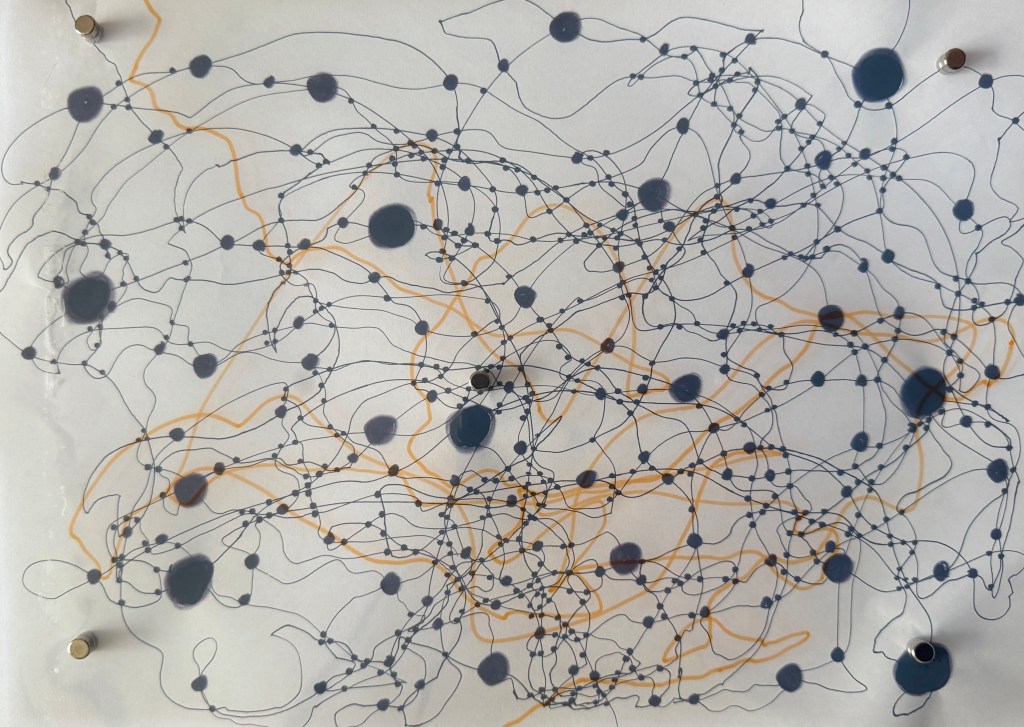
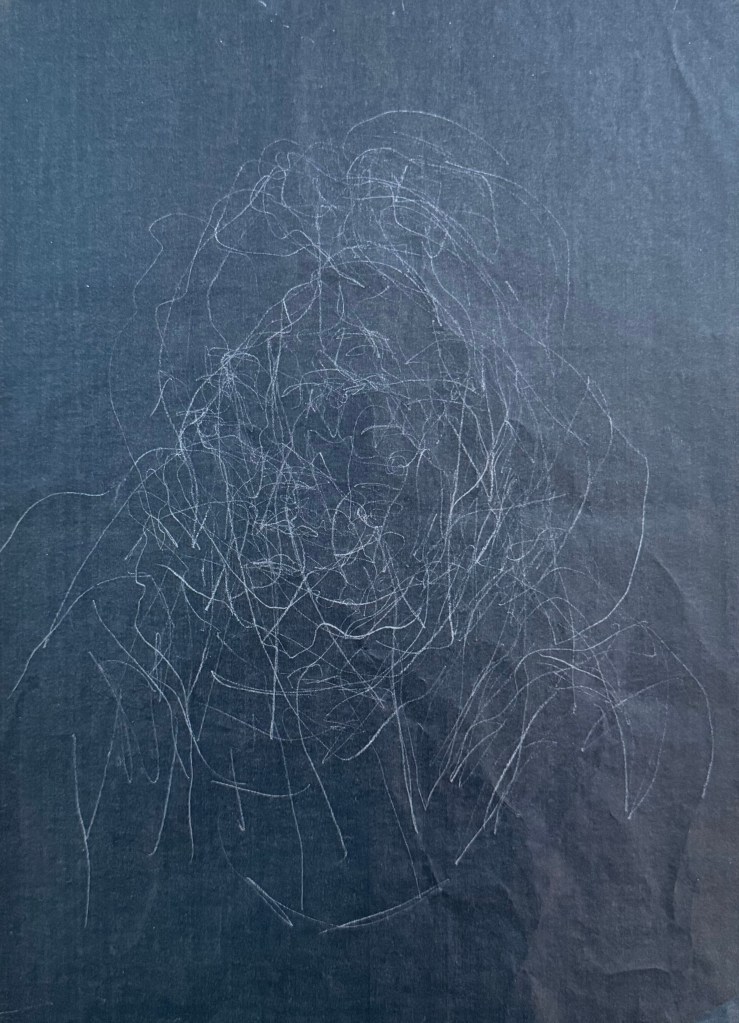
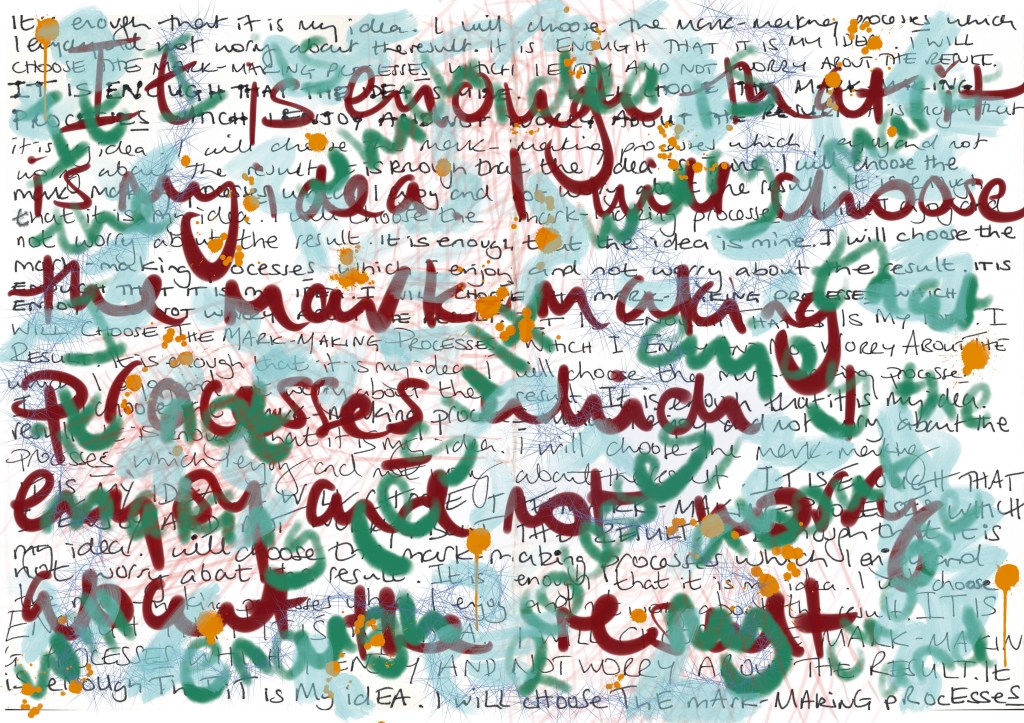
I used up the leftover ink to make some mono prints. The inks are safe wash – they are oil-based but soluble in water. I like the effect of spraying the ink with water, and running the brayer over it. These could maybe form the basis of something else.