Summer II

I’m now playing catch up, tying up all the loose ends from the summer, which now seems an age away.

Once I’d seen Bourgeois’ ‘Maman’ I had a wander around the rest of Tate Modern.

I don’t know what it is about this painting, but I always find myself standing in front of it. It’s a self-portrait by German artist, Christian Schad, in 1927. Having previously been influenced by Dadaism, after returning from Naples he started painting in a smooth, realistic style as part of the New Objectivity, a reaction against Expressionism. He also created Schadographs, which I may have to have a look at. Maybe I’m drawn to it because it was painted at a time of decadence in Berlin and Vienna, or because of the narcissistic symbolism, or maybe it’s just the way he’s painted that really sheer shirt.

This is by British modernist, John Tunnard in 1942. It is an abstract landscape painting of Tol Pedn near the Lizard Peninsular, where Tunnard served as a coastguard during the war. The two small chesslike objects represent the two artificial landmarks on the coast warning ships to keep away from the Runnel Stone, a dangerous reef. I like the areas of texture which contrast with the flatter paint, and the overall balance of the composition.

I particularly like the aerial view feel of this work. It is Nocturnal City, by Maliheh Afnan made in 1987 – wax, crayon, oil pastel and ink on paper. She is influenced by the written form, in particular, Persian manuscript paintings. She ‘writes’ her paintings layering materials in which she explores, memory and places. Text has appeared in some of my work, and I like the effect of scraping into the surface to make marks, something that I do a lot of instinctively.

I had a look around the Emily Kam Kngwarray exhibition: she started painting in old age and made a mind-blowing 3,000 odd works in just a few years. I enjoyed looking at the mark-making and the colours, some reminiscent of mapping.

And then I saw an actual map in Richard Long’s Cerne Abbas Walk (1975) in which the sculptor/ land artist documents a six-day walk at a well known Dorset landmark, detailing his physical interaction with the landscape. I couldn’t help but stop and spend quite a long time just looking at his 8 metre wide Norfolk Flint Circle (1990) which creates its own extraordinary landscape.

I didn’t make a note of this next work which is frustrating as I was intrigued by the holes and layers beneath.

Then it was on to Do Ho Suh’s Genesis exhibition. Lots of transparent layers, grids and threads, all of which appealed to me.

Some wonderful Giacometti’s in the Tanks, emerging from the darkness and given form by the wonderful lighting.

An accidental slip of the phone, but an interesting image.

Prints

I’ve decided that I would like to make physical prints for the Editions Sale, if possible, and I have resolved to do a linocut, on the basis that I don’t have an etching press at home, and I probably won’t be able to make it in to CSM this month. I also want it to be something which is relevant to, and an extension of, my recent work.

I’ve not much experience of linocutting, but this is a good opportunity to try and improve my skills. I’ve been experimenting with some of the mapping imagery that I’ve been exploring over the last few months.

Originally I thought about the line drawing I did and how form can emerge from lines. I used my father’s silhouette from Solitude to experiment.

The lines are all over the place as I did them freehand (how does Bridget Riley manage?) and there were a few errors. In the top half I experimented with rounded curves, whilst in the bottom half the lines are flatter.

I tried drawing out how it might work but in the end I decided that it would just be too difficult, and gave up.

I then looked at the contouring and the automatic drawing that I have incorporated into some of my recent work. I used a group of three figures, composition yet to be decided, and red and blue as the colour choice for the time being. I created multiple layers in Procreate which then allowed me to play around with possible combinations.

I like the red and blue contoured background with the figures standing in front of the straight white lines (last two images), maybe using gold leaf or even metallic ink (which would be cheaper) to add some additional interest. I’ve also put the darker figure in the background so that it gives the feeling of being in the shadows, even though, technically, lighter figures are supposed to recede, which in this case they don’t seem to because of the background.

So I’m sorted, apart from the fact that it will need to be a reduction linocut, something which I haven’t done before, put off by the suspicion that my brain doesn’t work in a reductive way, but there’s nothing like a challenge. Maybe I need a Plan B, just in case.

Summer I

Whilst I don’t know where the summer went, it seems that I have quite a bit to catch up on.

As is our habit, we went to the RA for the Summer Exhibition. I don’t think ‘A Die, A Log, With You’ was much missed. There was the usual mixed bag. I felt myself drawn to any pieces which bore any resemblance to maps or mapping.

I think I know what my entry next year will be, irrespective of theme.

Then we went into the Kiefer/Van Gogh exhibition. I didn’t expect to enjoy it and I’m not sure that enjoy is the right word anyway. The works are huge and for once I didn’t really even register their size, because it was inherently obvious why they were the way they were. I sat in front of the first image below (Crows) for ages. In my mind the path leading up the centre was wet and muddy, the kind on which you can’t get any traction, putting in lots of effort but slipping and sliding all over the place and getting nowhere. Despite its warm colours, it felt bleak and desolate.

The works have a three dimensional quality with Keifer’s use of straw and clay. It’s as if he is reconstructing reality on the canvas, the surface of the works offering up their own landscapes, casting their own shadows. It must have taken ages for them to dry.

Carbon Dating II

In the words of Vinnie Jones: it’s been emotional.

Over the last 54 days I have been mapping my emotions each day, using orange for positive, green for neutral and blue for negative. At the beginning, I was going to use different shades of each colour but I soon realised that this would over-complicate things. I also realised that I needed to put some rules into place: I started each line from the dated contour line, drew for two minutes, trying to explore as much of the sheet as possible to achieve an even distribution of mark-making, and finished the line off the page. I wanted to make it so that theoretically I can pick any day and trace the line which represents it. I drew each line at the end of the day, and took a photo. Unfortunately, sometimes it wasn’t light enough and so I had to take photos including a number of days’ worth of lines, so instead of having 54 photos, I’ve only got 46 which has resulted in a sudden surge in orange lines towards the end – maybe I was enjoying the positive. They are not the best photos – the lighting is all over the place. Next time I do something like this I will try and make them consistent, although I do quite like the movement it creates.

What have I learnt from this exercise? Had I not done it and you had asked me what the last 2 months have been like for me, I would have said that they have been difficult, and that for the most part I have felt negative emotions such as sadness, grief, stress, frustration and anxiety. However, looking at the end result I can see that this isn’t actually the case; I can see that there are more orange lines than green, which in turn outnumber the blue. This must mean that I feel negative emotions more strongly than positive ones, and this results in my perception of life being somewhat skewed. The map reflects this, in that, whilst they are few in number, the blue lines jump out at me from the rest. I think the technical term is the negativity bias. I don’t think that I would have had the same result had I represented my daily emotions diagrammatically in a chart – it matters that each day is individually represented. Maybe there is another way of doing it – I’m just not a mathematician!

I found the exercise to be a positive one; the act of drawing a line each day not only meant that I was making, but it also allowed me to reflect on the day as I drew – a form of visual journaling. I enjoyed the process of it and whilst it can be said that the resultant map is interesting, what it reveals also became apparent during the process itself; as the map was becoming each time I engaged with it, so I was becoming.

As ever, I’m not sure how I can develop this, if at all. Or maybe, there’s no need. Today was the last day. I think I will miss doing it, so I might just continue.

Wayfinding

I think that I’m finally getting some clarity. Or maybe I’m seeing connections and signs where perhaps there aren’t any, but it seems to make sense, in my head anyway. In my second tutorial, Jonathan commented that he had a sense that it was all leading to something (the first sign).

So far during this course, trite as it may be (although Jonathan has assured me that it is essentially what art is about), I have been concerned with understanding myself and my place in the world as a practising artist. I’ve been working from memories, guiding me like a compass on my exploration, probably slightly off kilter, as well as my day to day life, thoughts and feelings. I have been trying to concentrate on the process as opposed to the result (a sign), experimenting along the way, and producing very few finished pieces of work. I did feel uneasy about the lack of finalised output, but no longer. I’ve been on a dérive (our session on Guy Debord being another sign).

In my Study Statement I question whether it is actually possible to ‘find myself’. Kierkegaard thinks not, in the sense of a static and unified concept, for the self is constantly being formed not just by reflecting on the past but also by engaging with the present; it is in a state of becoming, in a state of flux, something I have said I feel on several occasions in this blog (a sign). I accept in my Study Statement that I can only hope to know myself as at a certain point in time, and that reflection is something which will have to be a continuing process. Something else I have mentioned on several occasions in this blog, to fellow course mates and to Jonathan, is that I feel like I am a different person to the one that started the course back in October last year (a sign); I have changed and I will continue to change – to become.

Recently, I’ve become interested in the subject of maps – the comment in my Unit One feedback that I seem to be engaging in a process of mapping jumped out at me (a sign). That led me to start thinking about maps and the process of mapping and map-making, experimenting with cartographic symbols and mark-making. The subject of maps is a huge one but during my research I came across the philosopher, Korzybski, the father of general semantics, a central principle of which is that the map is not the territory (rather like the image is not the thing: Magritte’s Ceci n’est pas une pipe (I used this idea with my red telephone at the Interim Show (yes, another sign)). In short, our models of the world are abstracts of reality, and do not represent it. This is a principle I’ve been trying to be more mindful of since I read about it – my map of the world is not the same as everyone else’s, so we can be in the same situation or look at the same photograph but have our own very different experiences and interpretations of it (our sessions with the photographs being another sign). Something which is blindingly obvious, but which I don’t always appreciate.

This then led to the notion that geographical maps themselves do not reflect the territory in the sense that there is abstraction and subjectivity in the production of all maps: the size of countries and borders can be manipulated for political and social ends, the purpose for which a map is intended can determine what is included and what is left out, viewpoint and projection can distort the world view.

Mercator Projection

Authagraph Projection

The Authagraph Projection is considered to be the most accurate flat representation of the world. It highlights the distortion caused by the traditional Mercator projection in terms of the size of Africa, South America and Greenland, amongst others.

I have been reading a lot about cartographic theory, a discipline which has only become a thing relatively recently. There is lots of disagreement about what a map is and the separation between the artefact of the map and the process of mapmaking and mapping. Post-representational cartographic theory does what it says on the tin – it argues that maps are not the territory but actually create the territory, are in a state of flux and are constantly changing, and theorists have moved away from the idea of a map as an artefact, but as being performative and processual, and always in a state of becoming.

Whilst working, I have been reflecting on past events and experiences, but whilst doing so I have been conscious that my recollections are probably my version of the truth; that I am my own unreliable narrator. I have been interested in memory for a while, particularly as to its probable unreliability and its potential to be manipulated. The way memories are formed and retrieved means that they are not fixed archives, but are constantly being formed and reformed with each retrieval; they are in a state of becoming.

The link between selfhood, mapping and memory is the concept of the state of becoming: ontogenesis. In my research paper I want to explore ontogenesis in the context of autobiographical artistic practice because it is the essence of what I am trying to do. In my experimentation and production of unfinished work I am engaging in the process of mapping, changing and becoming, relying on my memories which are also in a state of becoming but how can I represent this in a visual form which is also in a state of becoming? Hopefully, by the end of the research paper, I will have a better understanding as to how it can be achieved, if at all.

That’s the plan for now anyway, although I may change my mind, in my state of becoming.

Trying to Move Forward

I decided to try and progress the idea of automatic map-like drawing by experimenting with charcoal. I drew a single line and then rubbed it out and repeated the process numerous times, building up layers of mark-making. I then took some coloured pencils and traced a path randomly following the marks.

I’m not sure that it takes me much further forward in developing this line of enquiry. However, I enjoyed the process and I like the different nature of the coloured lines which I made consciously by making decisions as to which of the paths of faded charcoal to follow, almost like a dérive – they have a different character to the ones I make when I draw automatically.

I’ve been thinking a lot recently about the course, about being half-way through and what I would like to have achieved by the time it finishes – what work I might produce by the end of it. At the moment, the concept of mapping is at the centre of it. I want to produce something which reflects all that I have learnt during the course, about myself and how I relate to the world around me. It will inevitably be an artifact, a map, of some shape or form, but I want it to reflect a process which is ongoing, that will never be complete, a piece of work in a state of flux, constantly subject to change, so there has to be some sense of impermanence, of it being unfinished. I also want to encompass the idea that memory plays a large part in the process and much like maps which are constantly being made and remade, so are the memories on which the map is based. The idea of layers and distorted imagery seem to be relevant in this respect.

I’ve thought about paper and canvas, maps being folded and rolled , but I don’t think that these offer the ability to create layers in the way that I want. I’m currently thinking that I may make a number of squares which together make up the grids of a map.

I used a pen to try and keep a marble on the paper. I like the lines which were made as a result – they have a sense of fluidity about them, much more than the lines that I have been making up until now. I’ve been meaning to experiment with the size of the dots at the intersections, to see if different sizes create a sense of perspective and three dimensionality. I don’t think that I have managed to achieve enough diversity in the sizes – it was very much an afterthought – I’ll try again another time. The image makes me think of something neural, cognitive mapping?

I took some inkjet compatible transparencies and drew some lines to see if I could create layers. Unfortunately, they are not totally clear – they have a milky appearance, probably because of the coating which allows them to be used in inkjet printers. I need to do some research to see if this is the case or whether I can source some others. Having said that, the milky film does cloud what’s underneath, making it hazy, almost like a memory that’s not quite there. Ultimately, I’m thinking that I could use layers of acrylic sheets over a background image, possibly together with milky transparencies, some can be drawn, painted and printed on, and I can also include some cyanotype images as well a negatives. I could cut holes in some layers to allow direct access to layers below. The use of reflective surfaces would also add depth.

I layered up the sheets using small magnets which not only hold them stacked together but also act as spacers between the layers. I had to add one in the middle because otherwise the sheets would sag – this won’t be a problem with rigid acrylic sheets. The magnets themselves suggest impermanence, the ability to be easily changed.

Hand Map

In the accident, a 2 inch piece of glass managed to find its way into my daughter’s thumb via the underside of her wrist (luckily missing her artery) severing the main nerve and two tendons in her dominant right hand. Fortunately, she was taken to Salisbury Hospital, the regional centre for plastics. We make the 2 hour round trip every week for dressing changes and physiotherapy. Every week I take a photograph of her wound, mapping its healing, but also so that she can look at it when we get back home – she can’t look at her hand in the moment. It’s important that she reconnects her brain to her hand otherwise the hand map in her brain will be lost, as will any chance of recovering as much sensation as possible. Whilst some of the physio has been physical exercises to rehabilitate movement in the tendons, the majority of it is brain training: visualisation and mirroring exercises, analysing touch and sensation, using the good hand to teach the injured hand how things feel, teaching the brain the new language with which the hand is trying to communicate.

So, we decided that we would make something. I’ve been meaning to try out some tetrapak printing for a while. The process of incising seemed appropriate. I feel some responsibility – if I hadn’t suggested that she leave earlier, perhaps it wouldn’t have happened. The act of sewing, holding things together, helping things to heal.

I like that the wound is the subject, that the hand is suggested by the embossing. I debated whether to add more detail, more variety of tone but for once went with the less is more option. I used ordinary cotton thread but we decided that the colour wasn’t right so we went for embroidery thread – a brighter blue. As I was sewing I knew that it was too thick, that I should have separated it, but I just kept going. I knew it was wrong; she said it was wrong because now she couldn’t see the wound – I had obliterated the very thing that we were supposed to be embracing. I tried a couple more times until we decided that it was right. By then the holes were quite large but that in itself doesn’t matter – it reinforces the idea that often we have to endure further harm or pain in order to heal.

Carbon Dating

During my tutorial Jonathan mentioned carbon paper.

It brings back memories of a time when it was the only way to make copies, of secretaries putting a sheet between the top and bottom copies when they typed. Those were the days when the most technologically advanced piece of equipment in the office was a fax machine, which would regularly spew out reams of documents on thin, shiny paper, the print fading away to nothingness over time, thus requiring photocopies to be made, just like some present day shop receipts, so I’ve discovered.

So what to do with it? Recently, I have been reading about map-making and the act of mapping, considering the difference between the two. Contemporary cartographic theorists consider the process of mapping to be of paramount of importance, the creation of the artifact of the map being just one step in the process. In particular, psychogeographic mapping seeks to represent how individuals feel about the place they are in, a process in which subjective experience is prioritised over factual accuracy. Artist, Christian Nold, who uses a bio-mapping device to record individuals’ changes in emotional state, creates emotional maps of places, and one I’m particularly interested in is Brentford Biopsy because I used to live next door in Chiswick before I moved out of London. The project was undertaken in 2008 before areas of Brentford were redeveloped, and it’s really interesting to see how people felt about the area: it reveals so much more information than you would get by simply looking at a map: a map details the historic buildings and the riverside, but not how people respond to them, their view as to how they should be dealt with in future development, and how it actually feels to be there.

So, I’ve decided to embark on some emotional mapping of my own, not in relation to a sense of place (that may come later when I revisit my grandmother’s village) but of my day to day life. The bonus is that it means that I have to make a line everyday which will hopefully lead me to doing other making. I have drawn the contour lines using carbon paper (I‘m currently thinking that they may be too dark and overpowering, but we’ll see how it goes; it’s an experiment after all) and each one relates to an individual day.

I’ve already started, and it should take me up to the 12th of August. I’ve had to invoke some rules. There are three colours which represent three emotional states which I assess at the end of the day; green represents a neutral emotional state, orange positive and blue negative. Obviously within the generalised emotional states is a whole range of different specific emotions, but I decided just to keep it simple. Each line starts from the contour of the day in question and ends by going off the sheet otherwise it may be associated with more than one day. I draw each line for no longer than two minutes. I had thought about allowing myself however long I felt I needed and varying the intensity of the line depending on how I felt, but decided that would over-complicate things. The map will give an indication of how often I was in each emotional state over a period of time. I’m now thinking that I should have had another map on the go at the same time; not just to depict frequency but also depth of emotion. Maybe next time, if this works out.

I also found some watercolour paper which I had used for an unsuccessful cyanotype and experimented with it. I like the intensity of the colour against the blue background, and the way the coloured in areas look like countries on a map of the world.

The groupings of colours also remind me in a way of the Art Emotions Map which has been produced by Google Arts & Culture and the University of California, Berkeley, which I’ve spent a bit of time exploring and which reminds me of one of our Miro boards. My husband suggested that I could do something similar relating to life experiences, with getting married to him falling within ‘Wonder & Awe’. Oh, he does have a sense of humour!

Wondering About Wandering

It’s been almost 3 weeks since my tutorial with Jonathan, and even longer since my last blog post. I’m usually very good at writing tutorials up immediately afterwards, whilst I can still remember what we discussed. I don’t usually take notes – it’s too distracting.

Oh, how I wish I had taken notes, but I think that I can still remember the gist of it.

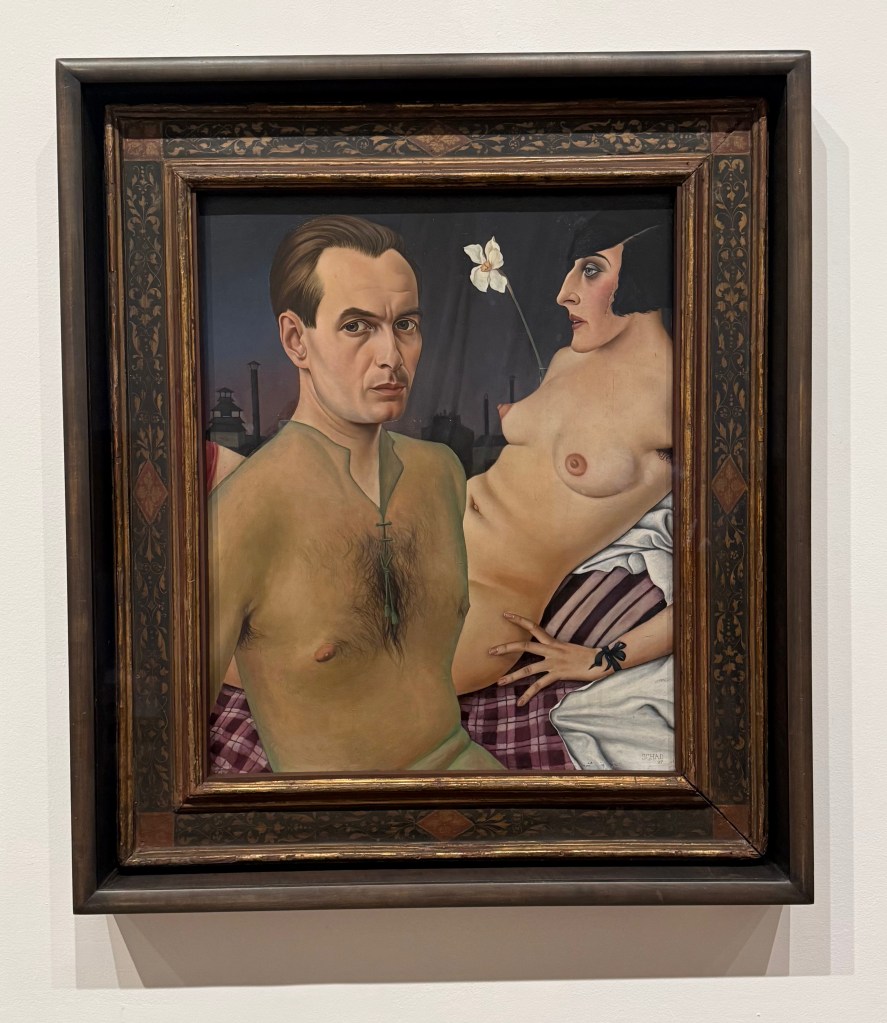
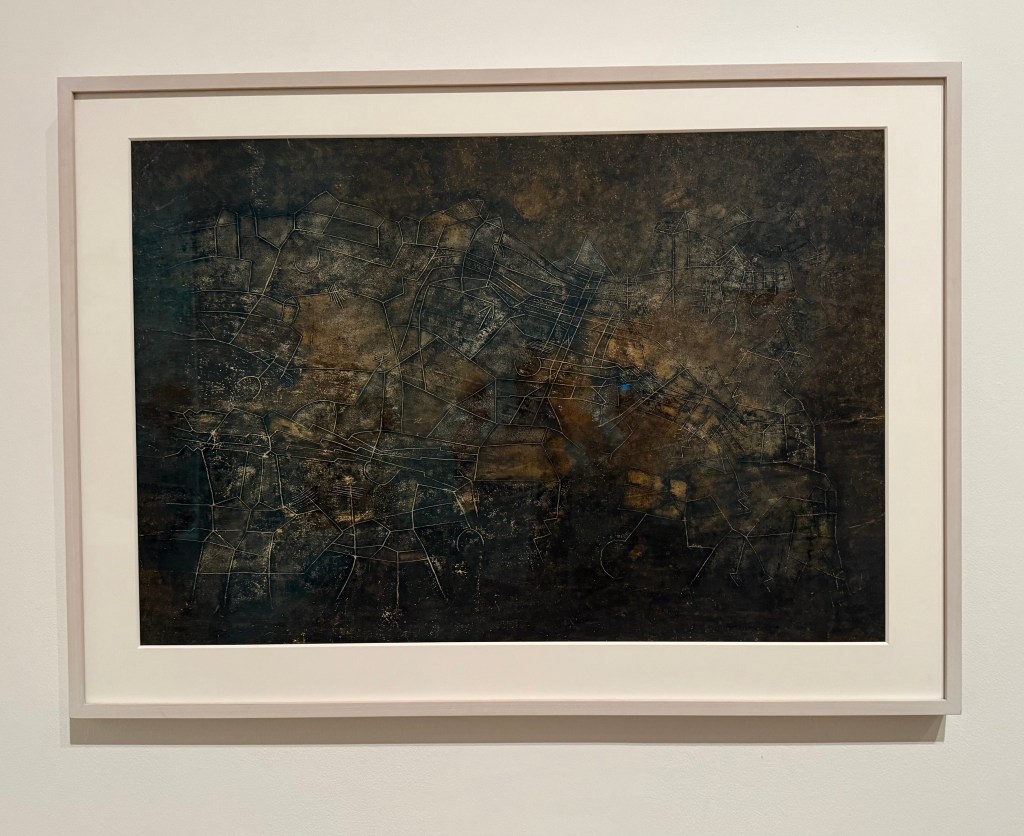
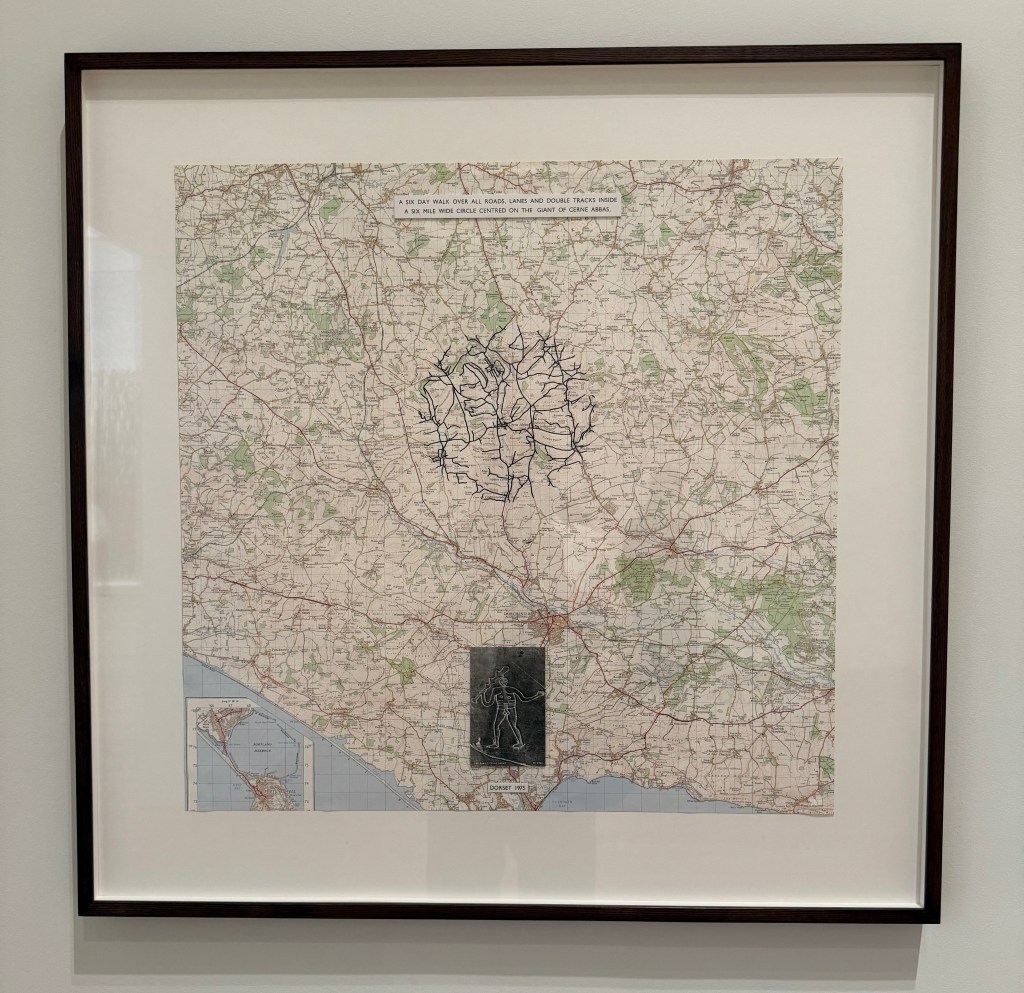
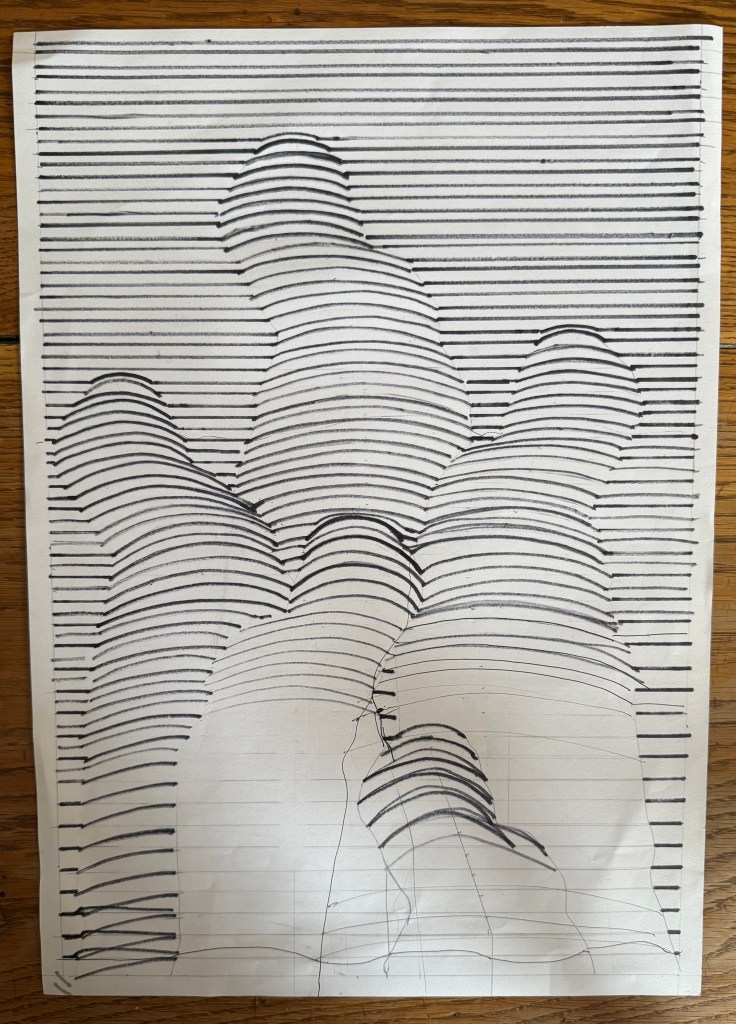
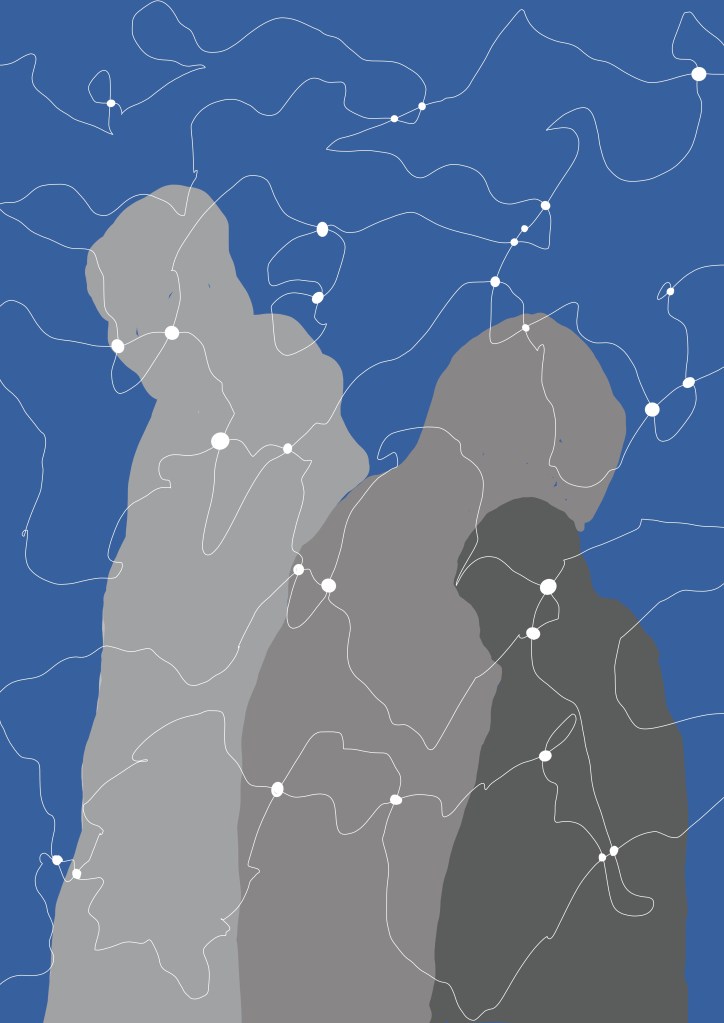
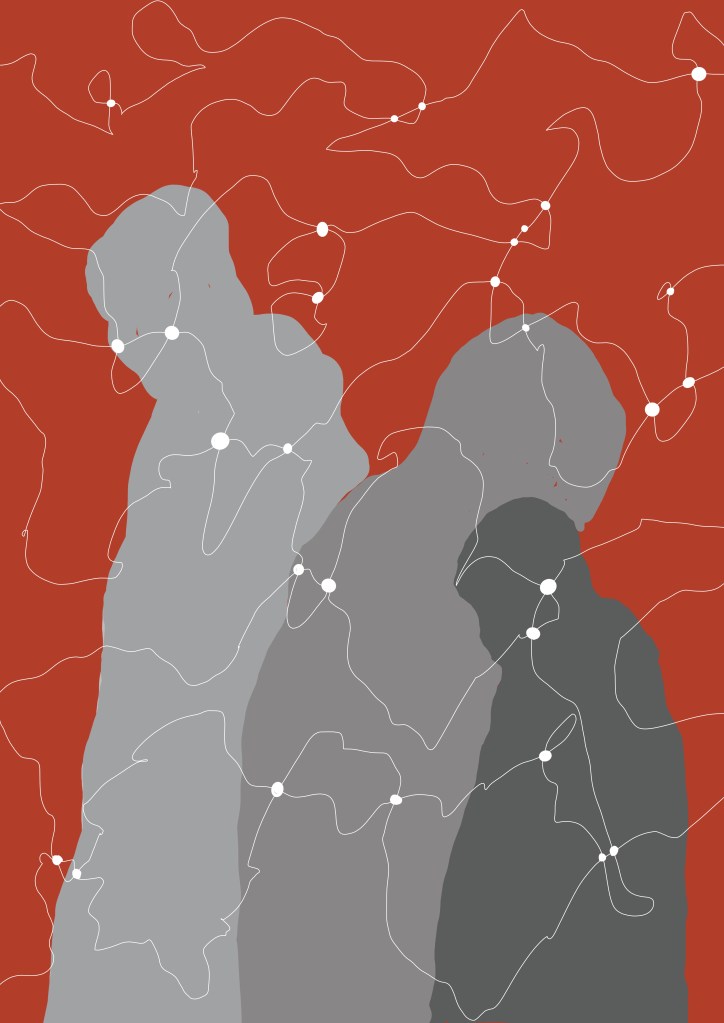
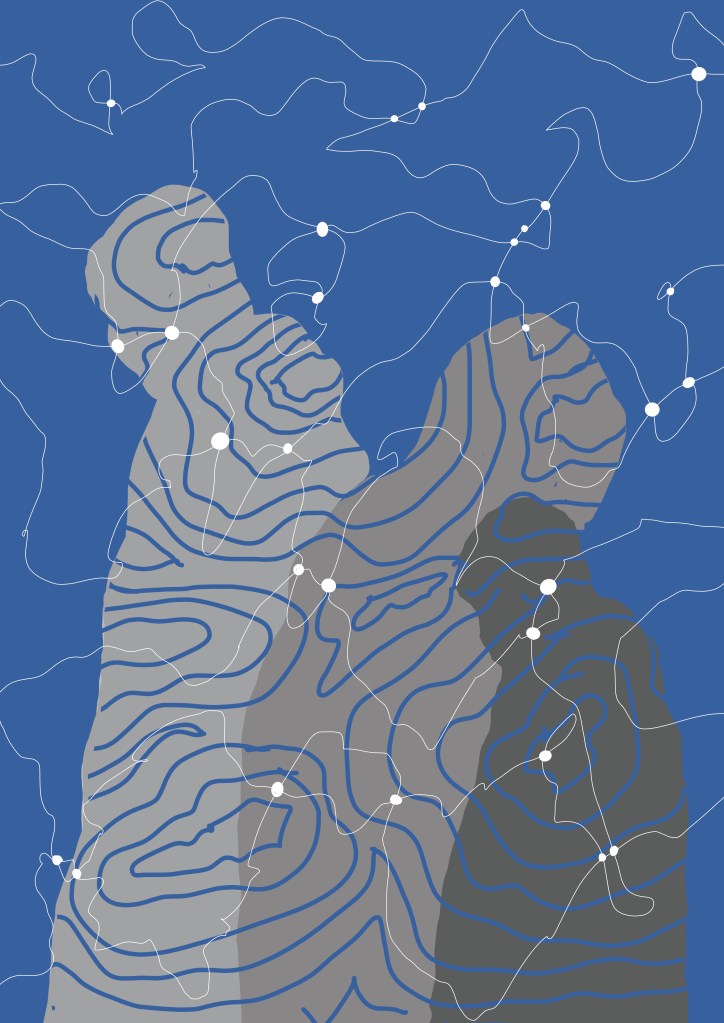
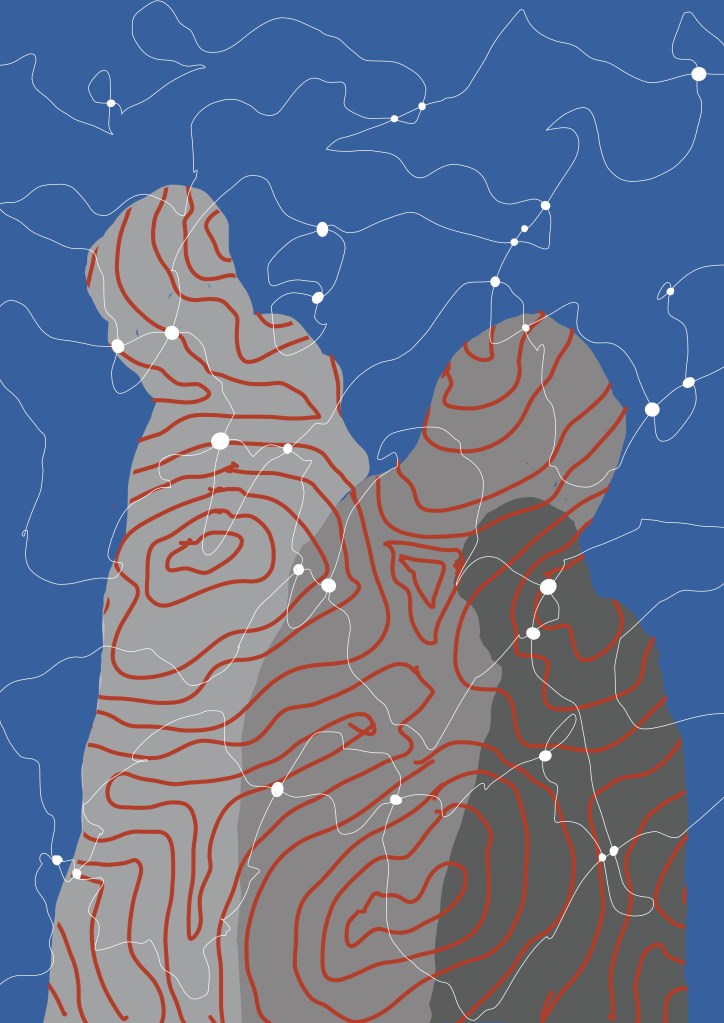
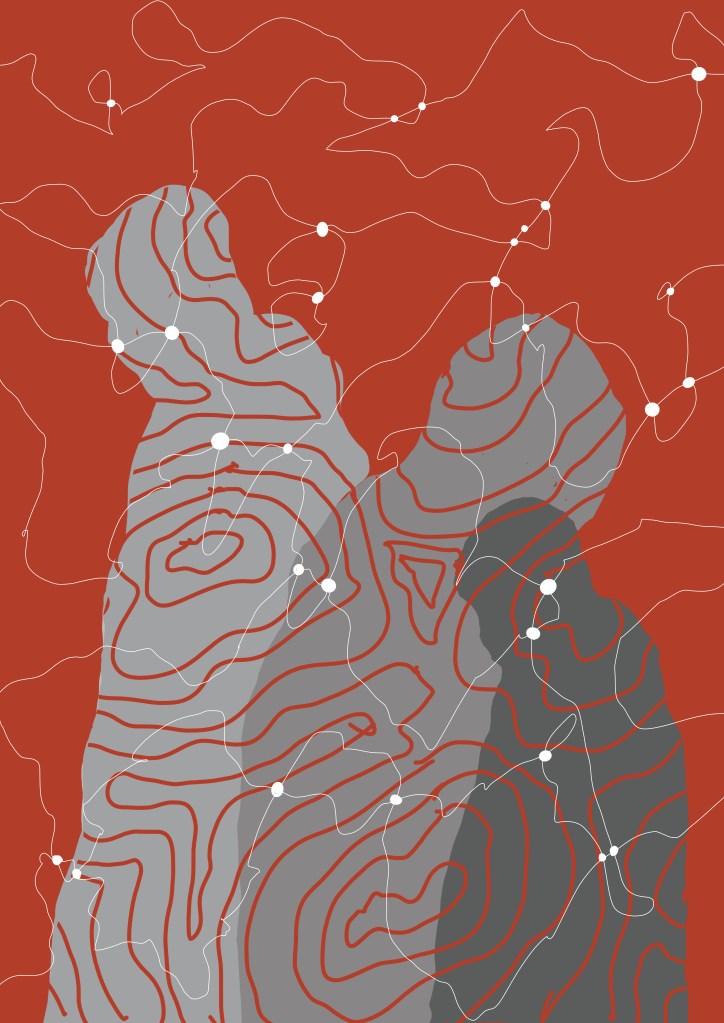
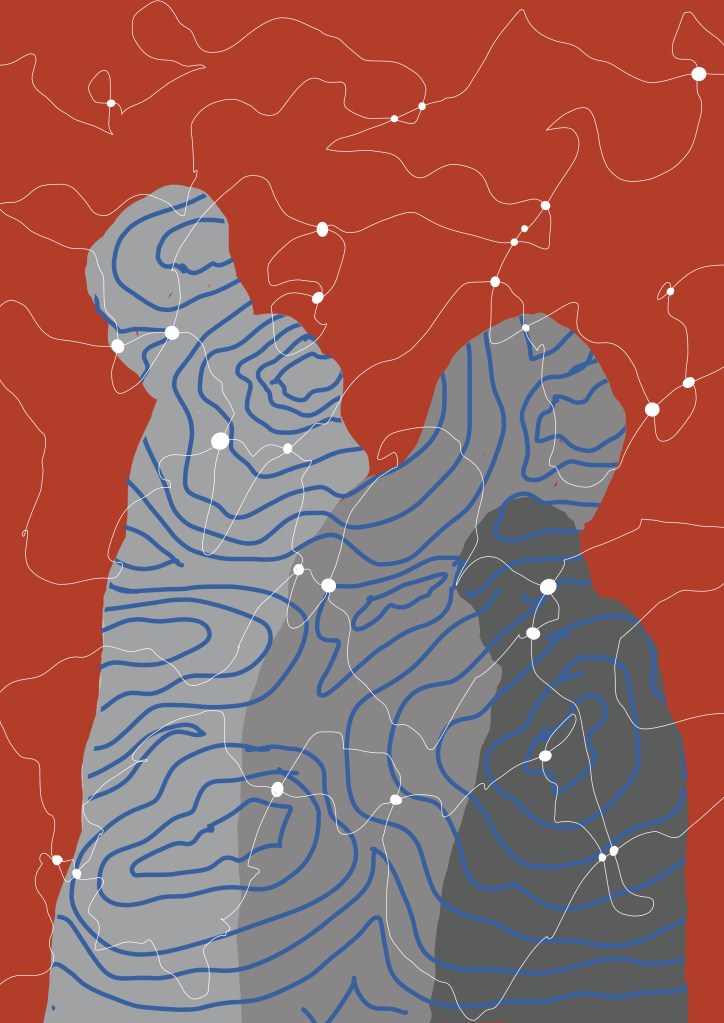
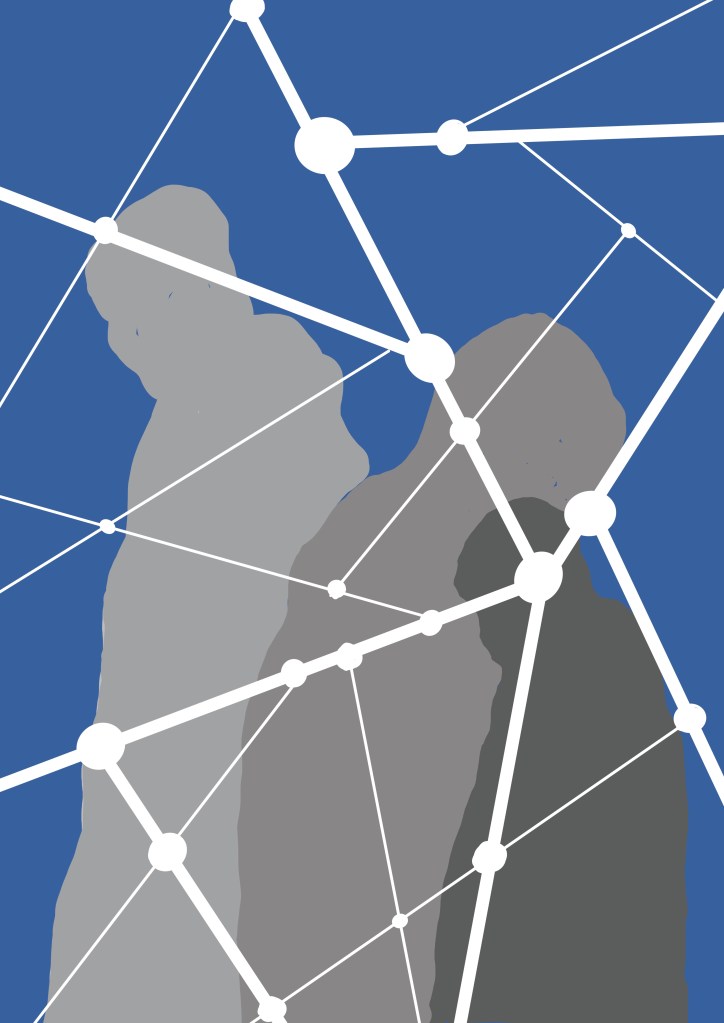
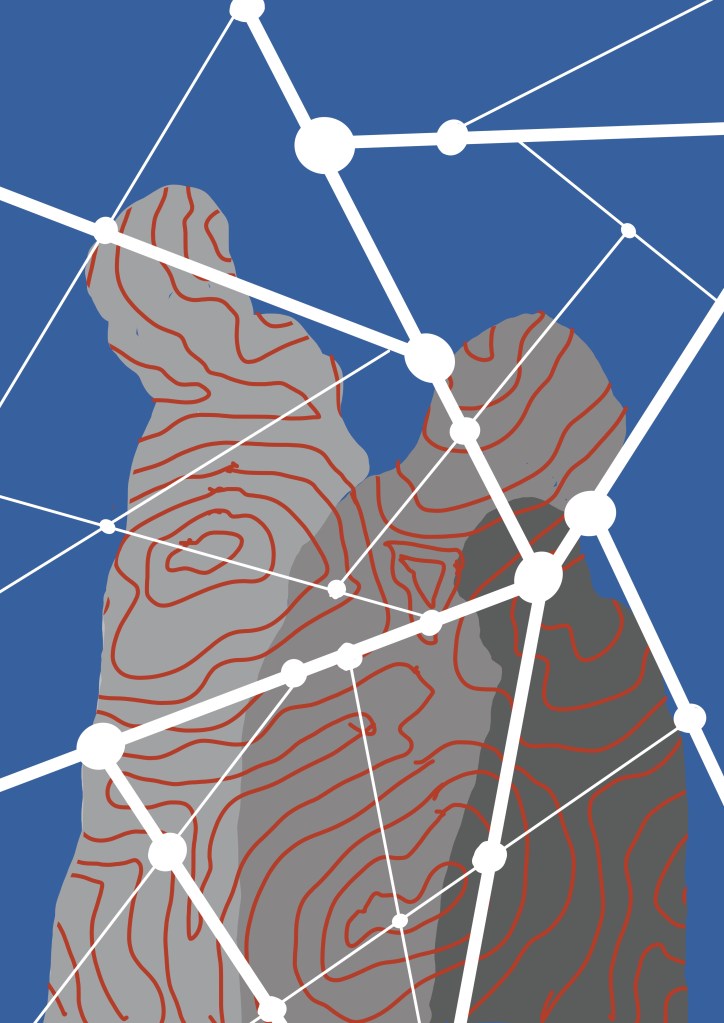
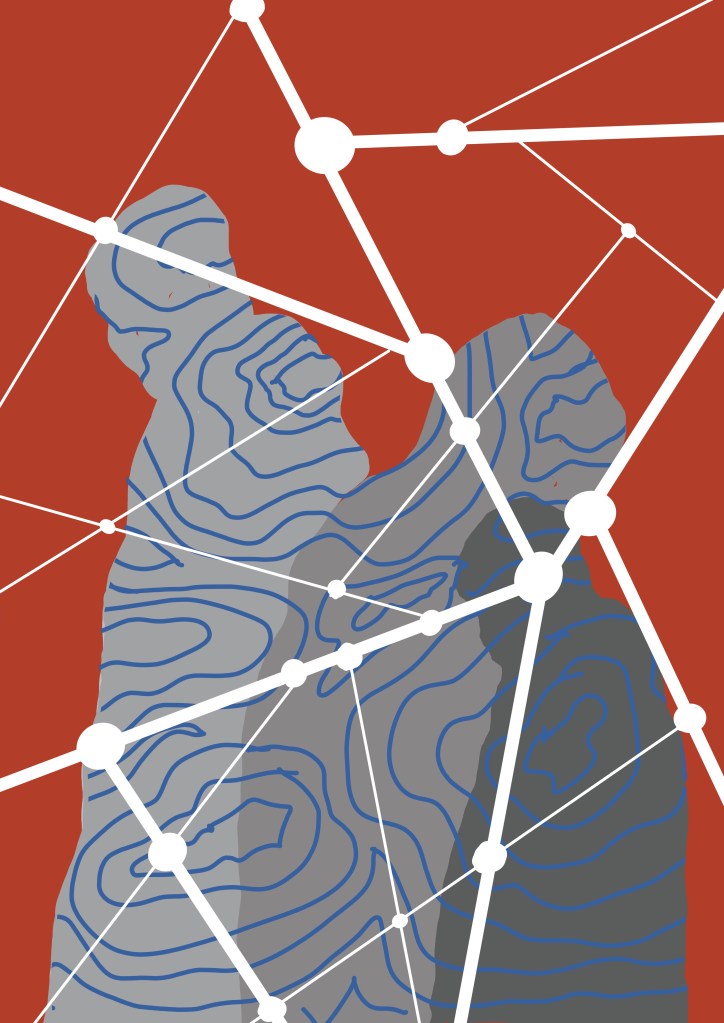
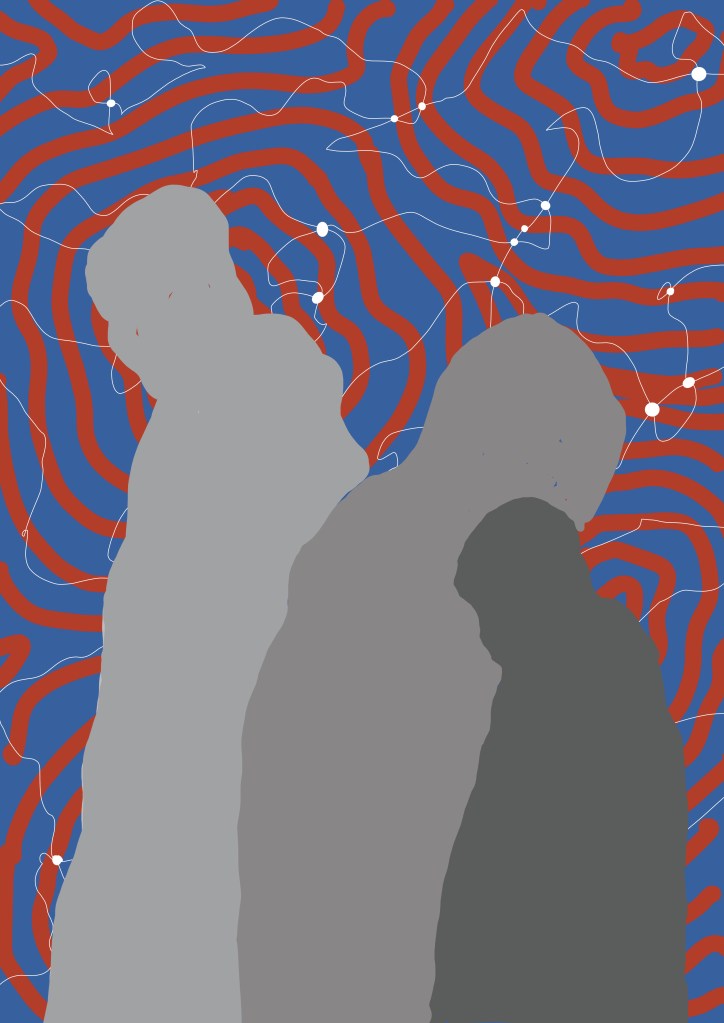
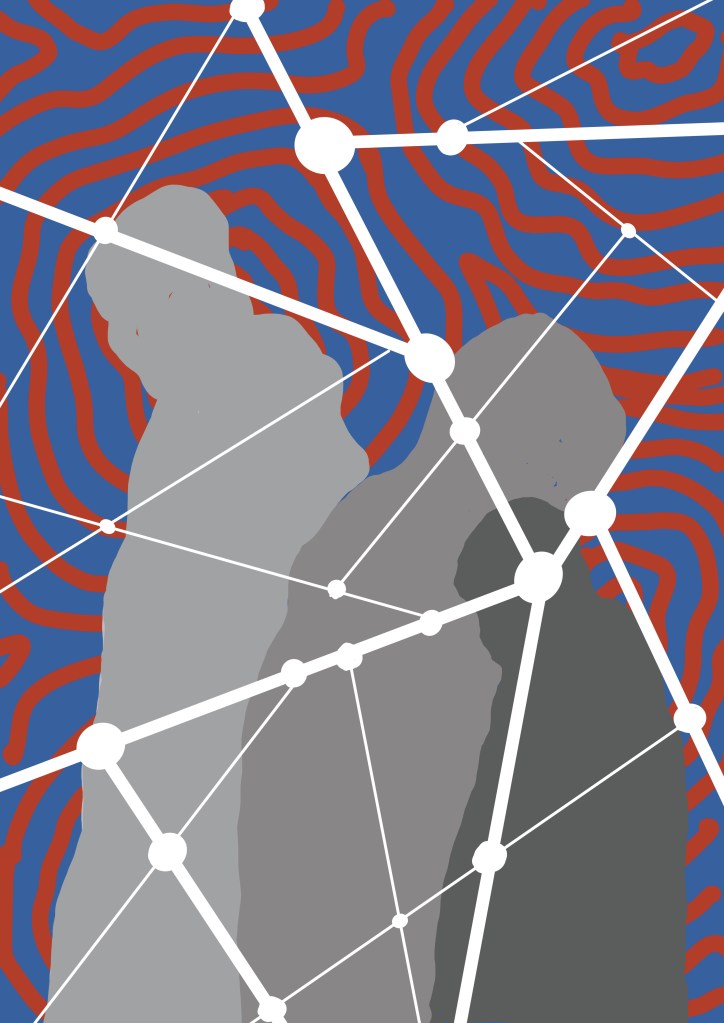
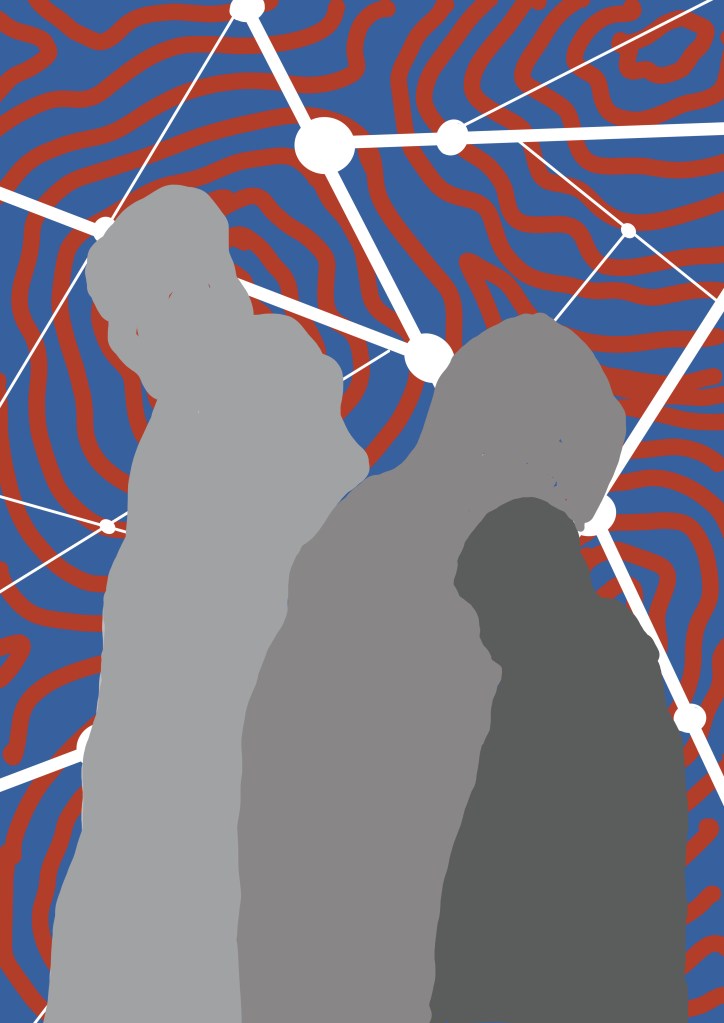
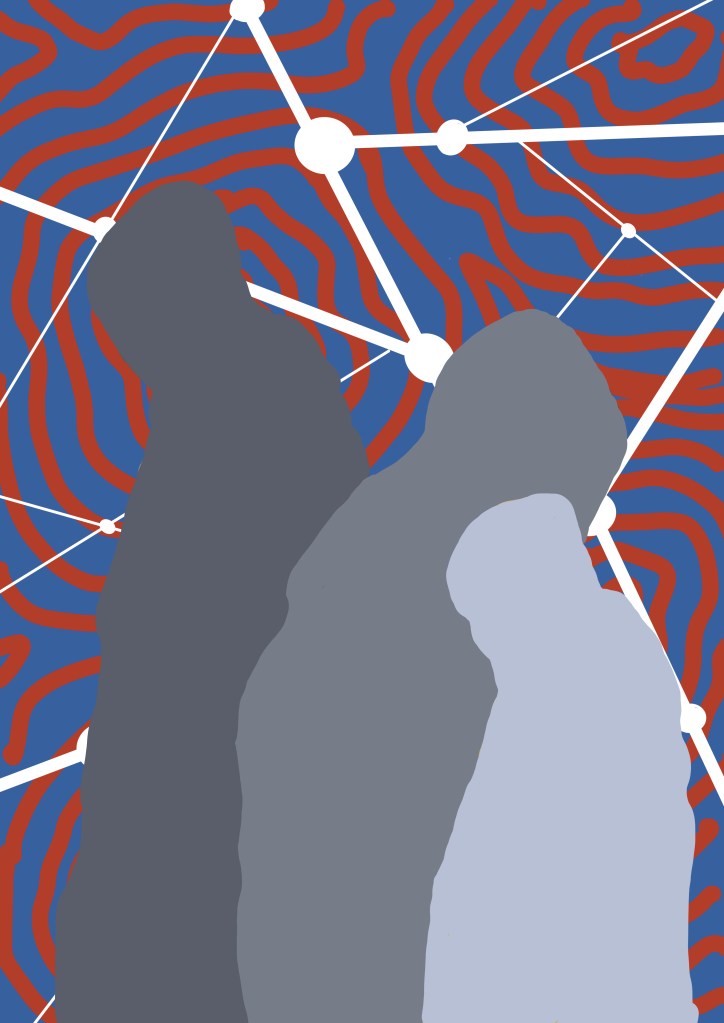
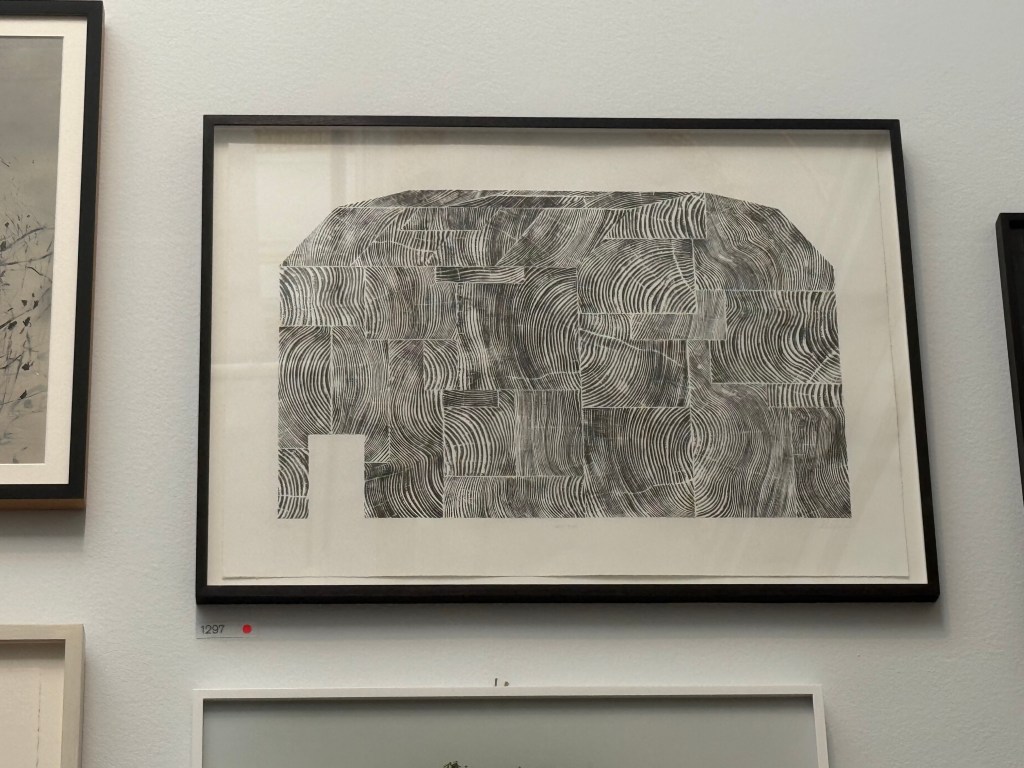
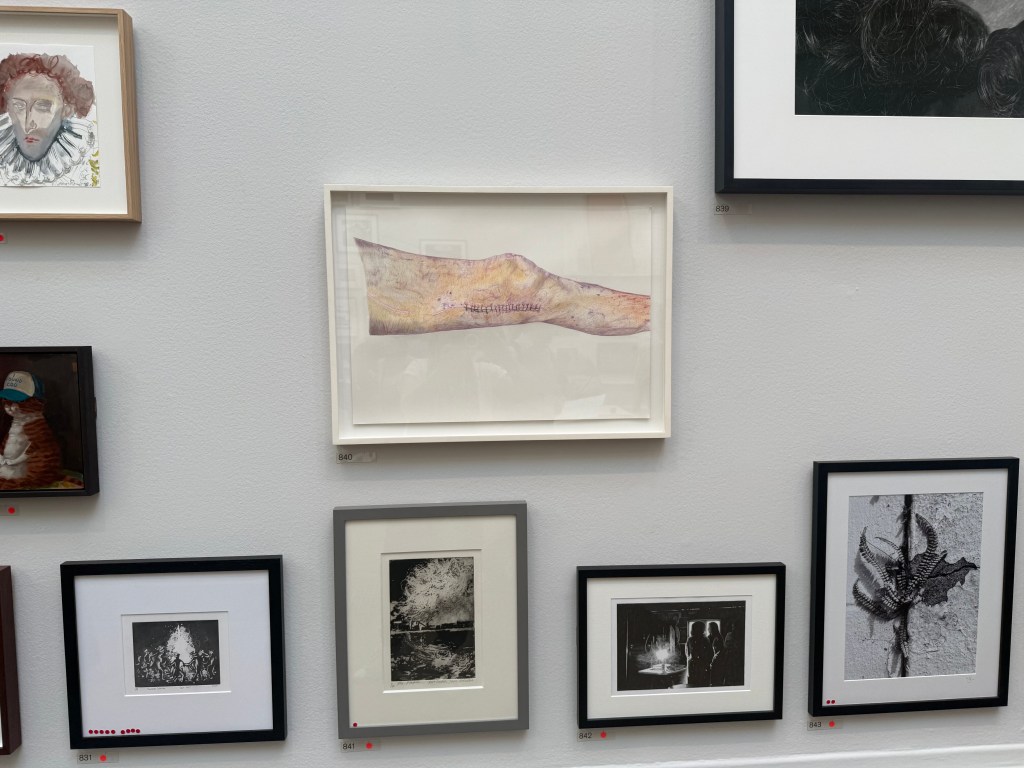
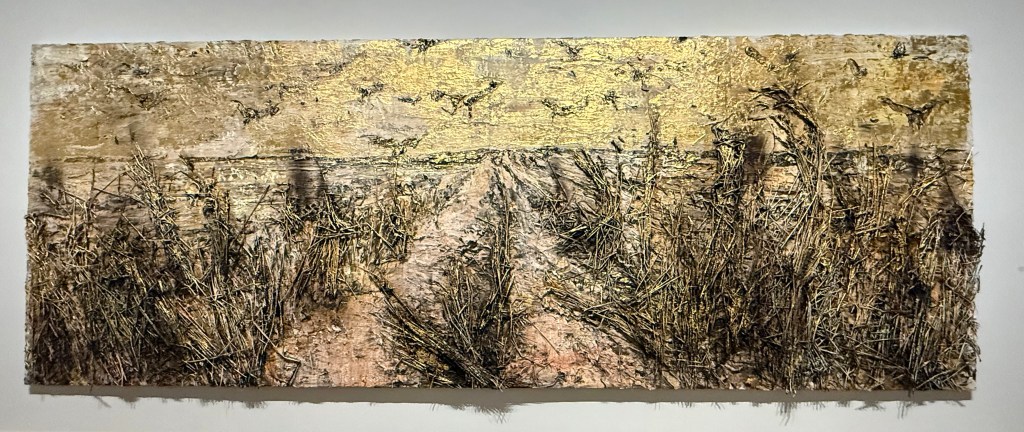
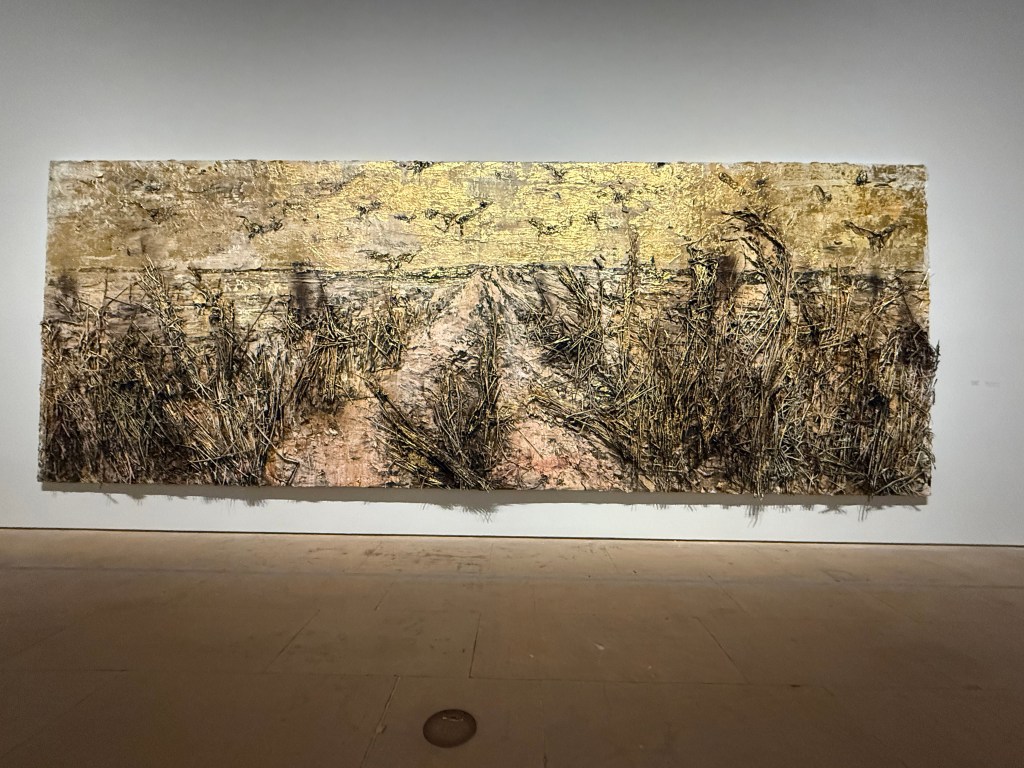
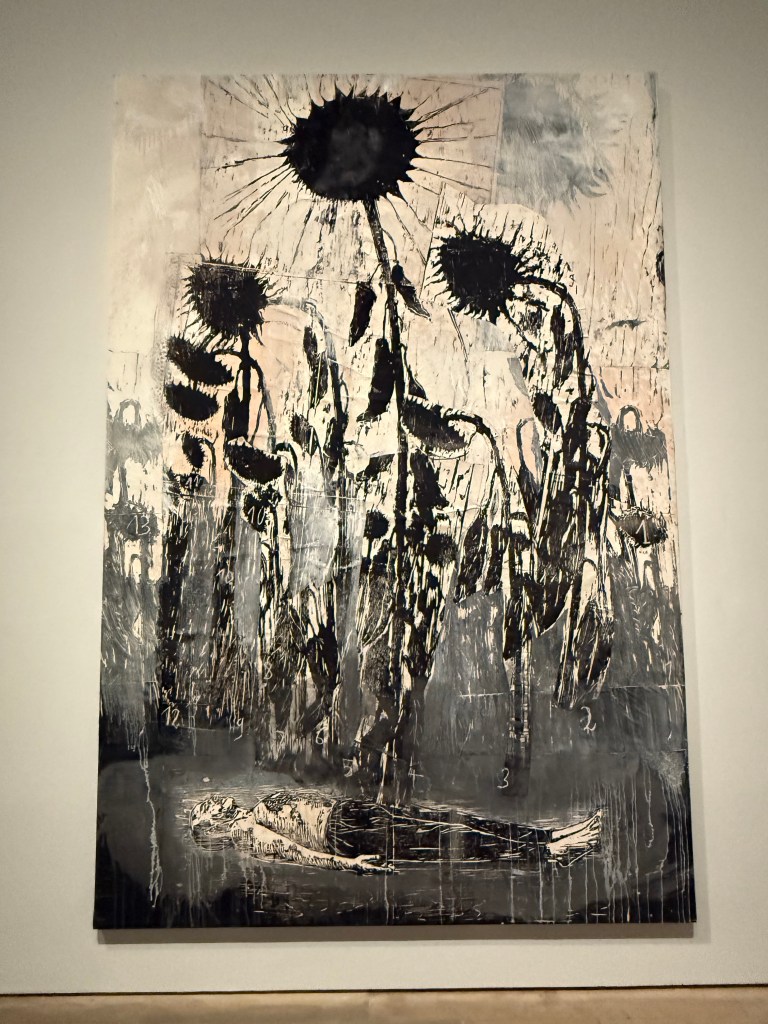
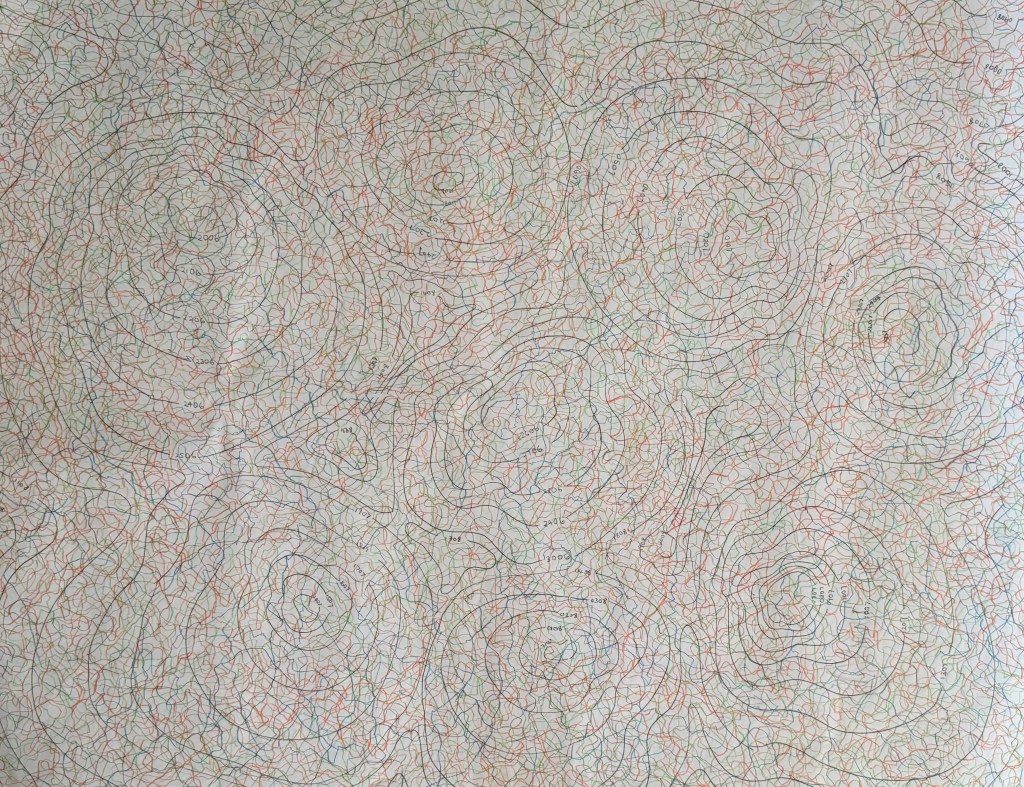
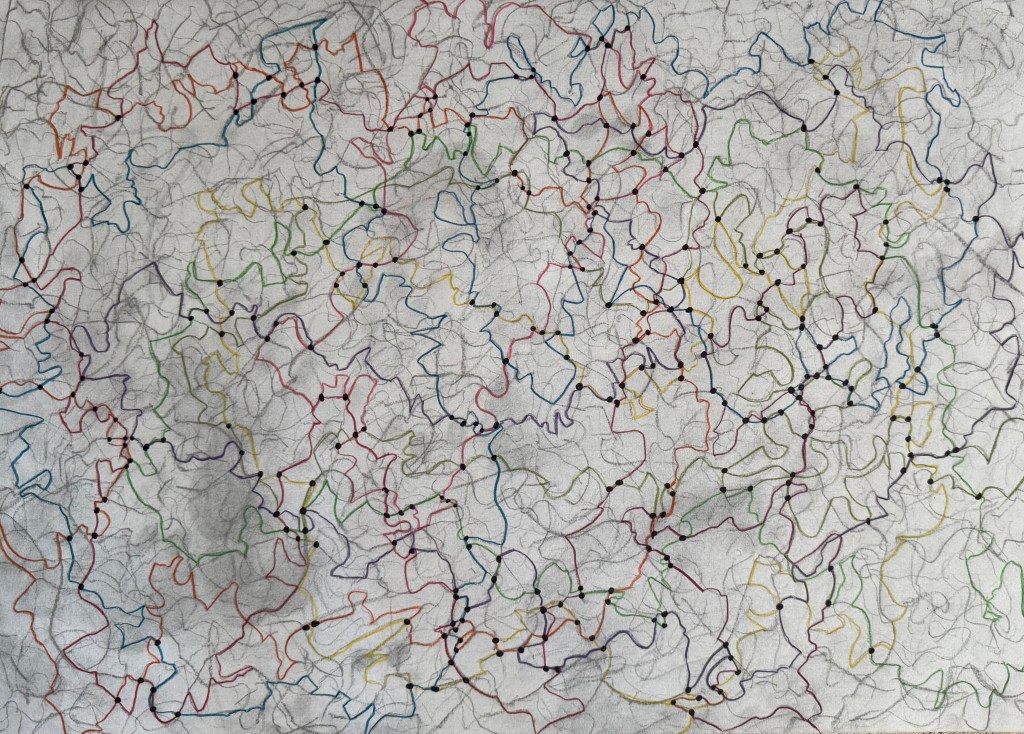
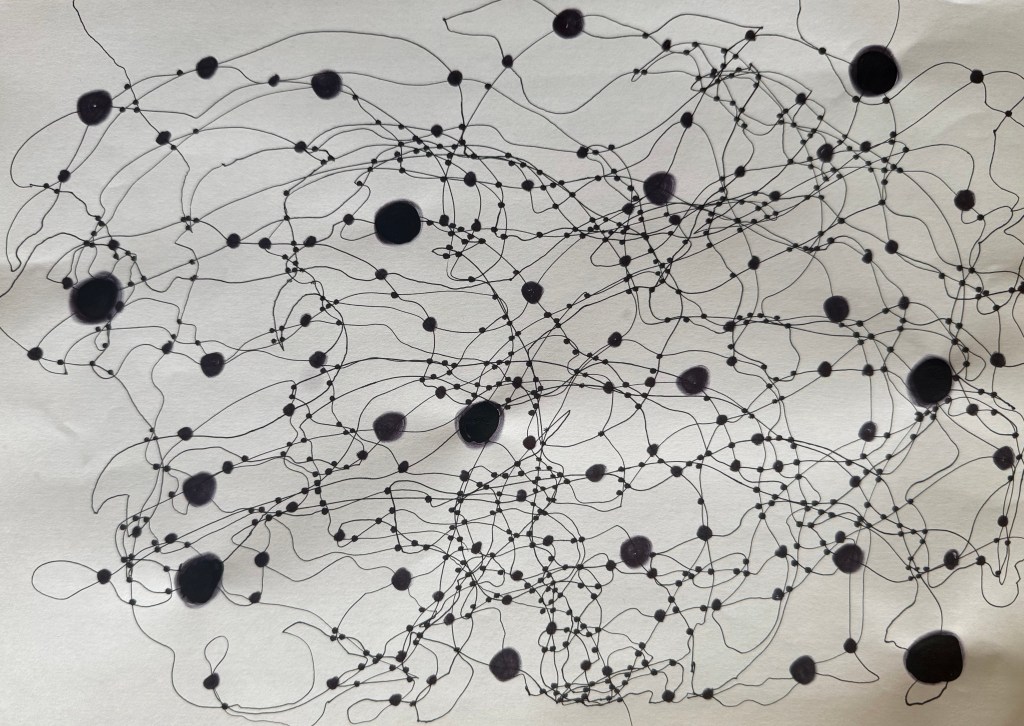
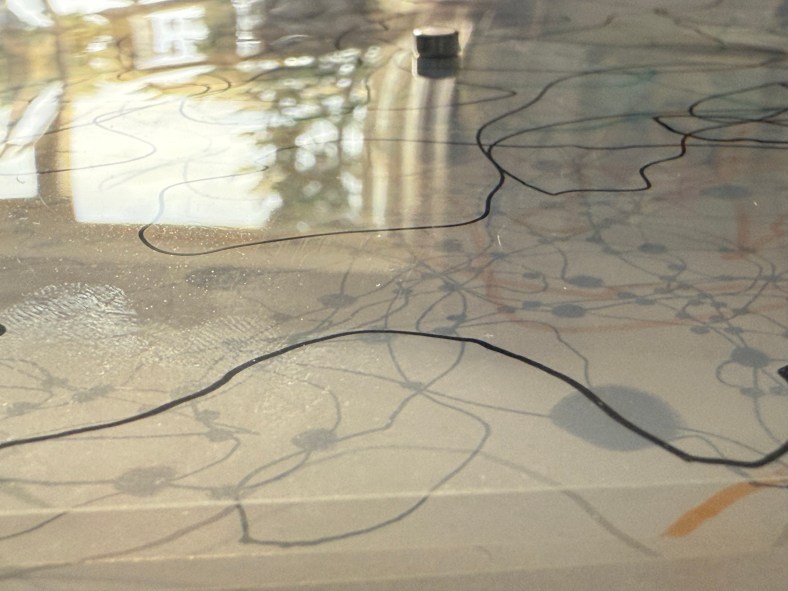
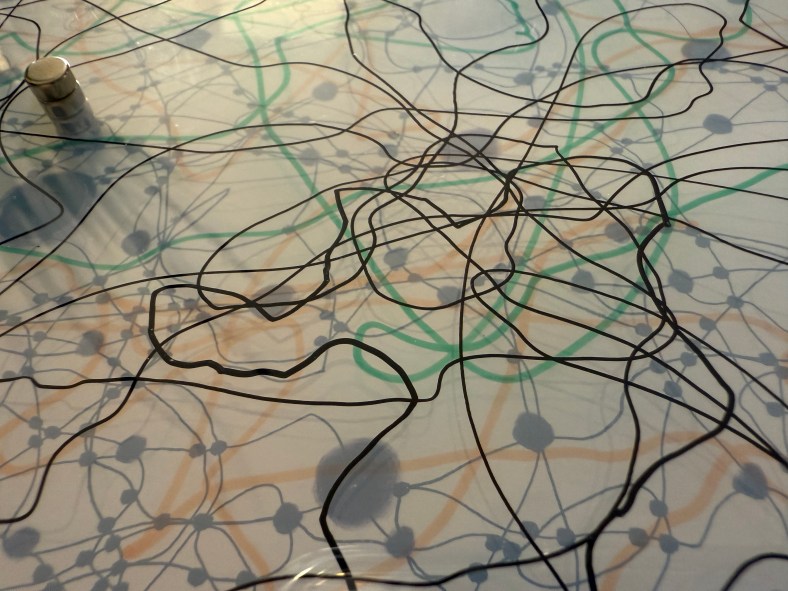
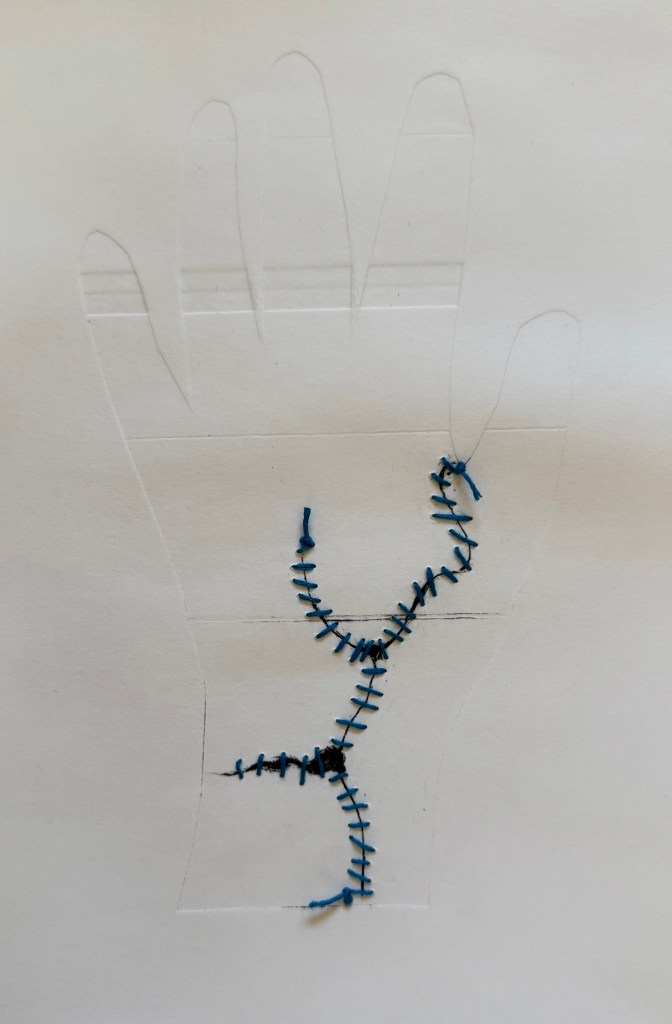
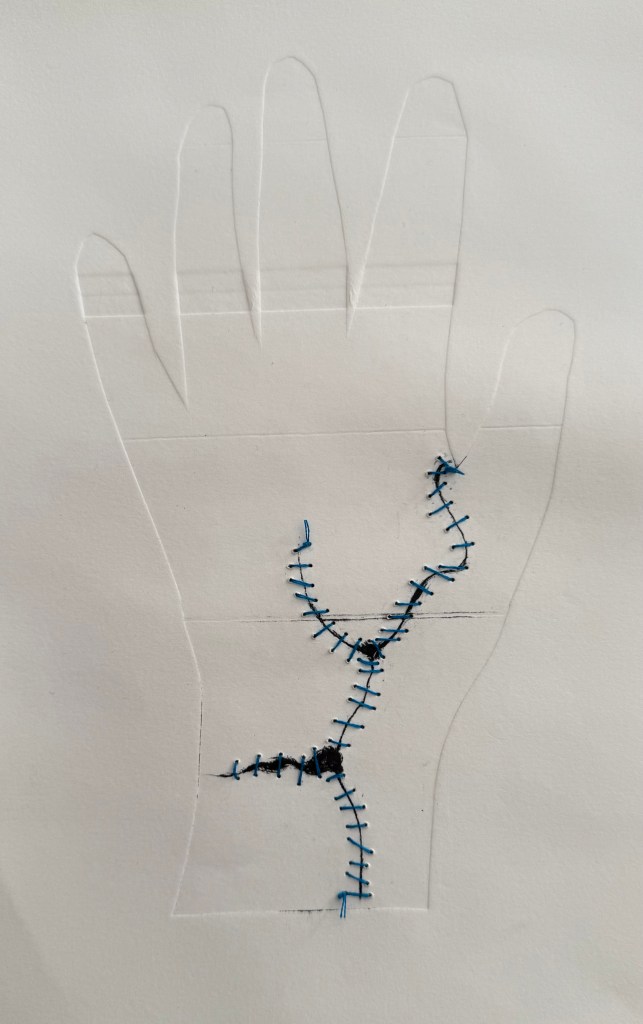
My clearest recollection is just how good it was to have a chat about something other than accidents, operations, hospitals and pain relief. On this subject Jonathan mentioned Late Night Ramblings, how at first glance it looks like a map but then when you look closer you realise that it doesn’t relate to anywhere. We talked about the methodology – what came first? I explained that I started off with the coloured lines, placed the dots at the intersections and then decided to add the contours and finally the grid – in retrospect I probably should have reversed the order as it was particularly difficult putting in the contour lines after the event – I couldn’t see the lines for the lines. We discussed the previous experiments which led to this point in particular the use of the photo of my father to create the outline of the figure, how the pose still retains its meaning, the angle of the shoulders and the head looking down, and how, because he reads my blog backwards from top to bottom, it only became apparent that the photo was the source of the outline once he had worked his way down. He also referred to What Was I Thinking? and my openness as to how I viewed my actions.

We talked about whether I would experiment with other media – I explained that I liked the flimsiness of the flip chart paper as it reminds me of the paper on which maps are produced and how I am interested in the idea of folding. Jonathan referenced how maps are folded, in a concertina, and how a piece of paper no matter what size it is can only be folded in half 7 times. Intrigued, I looked into this further after the tutorial finished. Generally, this is the case although in 2002, Britney Gallivan, a high school student in California, set a new world record by folding a piece of tissue paper 12 times, but it was 1.219km long. Funnily enough, whilst driving to Exeter yesterday morning to start and finish what my daughter was en route to do when she had her accident, clear out her room at uni, we had the pleasure of listening to Radio 2 when the Paddy McGuiness show came on, and listeners were invited to message in to explain how it can be true that if you fold a piece of paper 42 times it could reach the Moon? Did you know that you can only fold a piece of paper 7 times I asked my husband. Yes, you’ve already told me that, he replied. It’s a matter of exponential growth – if you assume that the thickness of a piece of paper is, say, 0.1mm, then when you fold it in half 42 times it will theoretically be 439,804km thick, approximately 55,000km in excess of the distance between the Earth and the Moon, the same kind of principle as in A Bird In The Hand.

I mentioned that I was thinking of creating a ‘map’ which would embody all that I have learnt over the course, and have been toying with experimenting with canvas, how I would need to think about image transfer etc. Jonathan mentioned Citrasolv which works really well on laser print, especially high quality print such as National Geographic. After the tutorial I watched a few YouTube videos, ordered some and have had to wait a couple of weeks for its arrival, this Thursday.

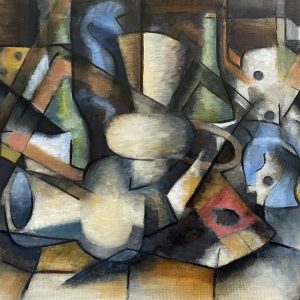
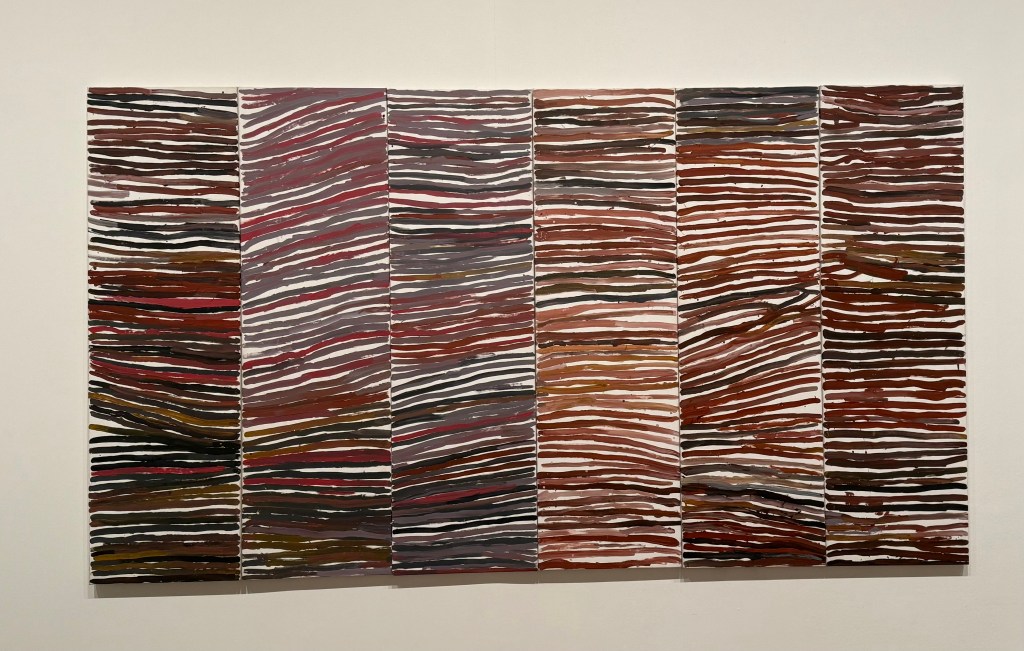
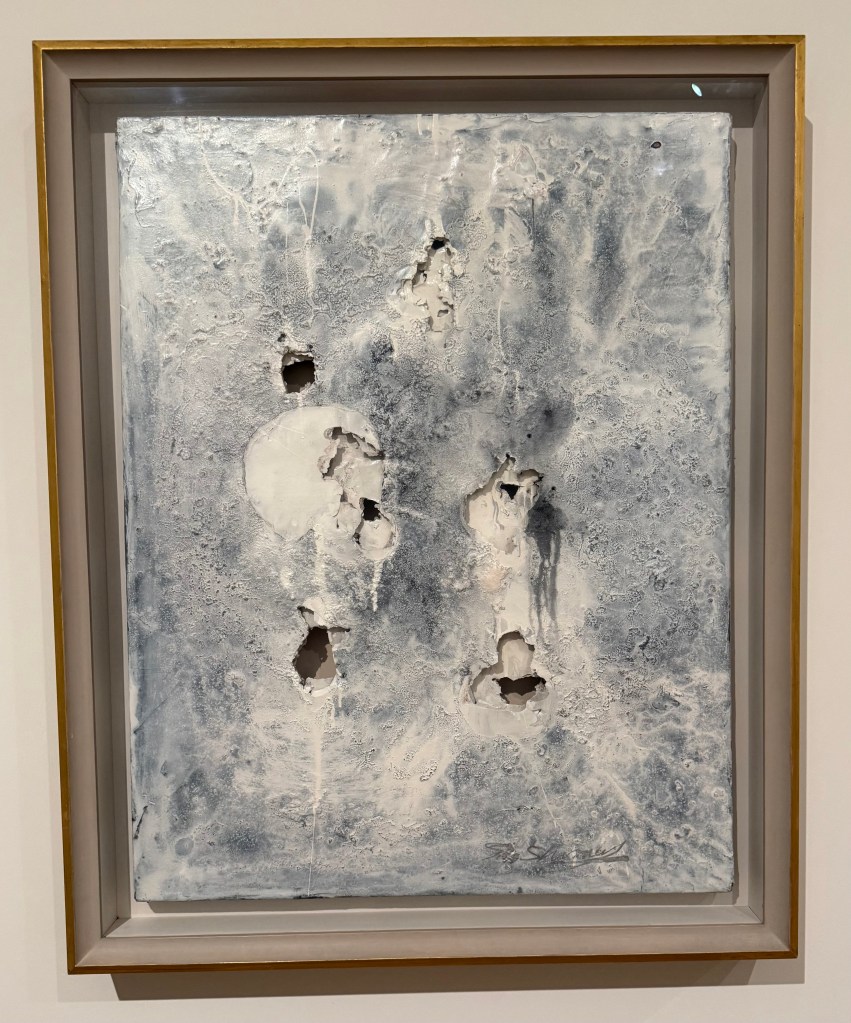
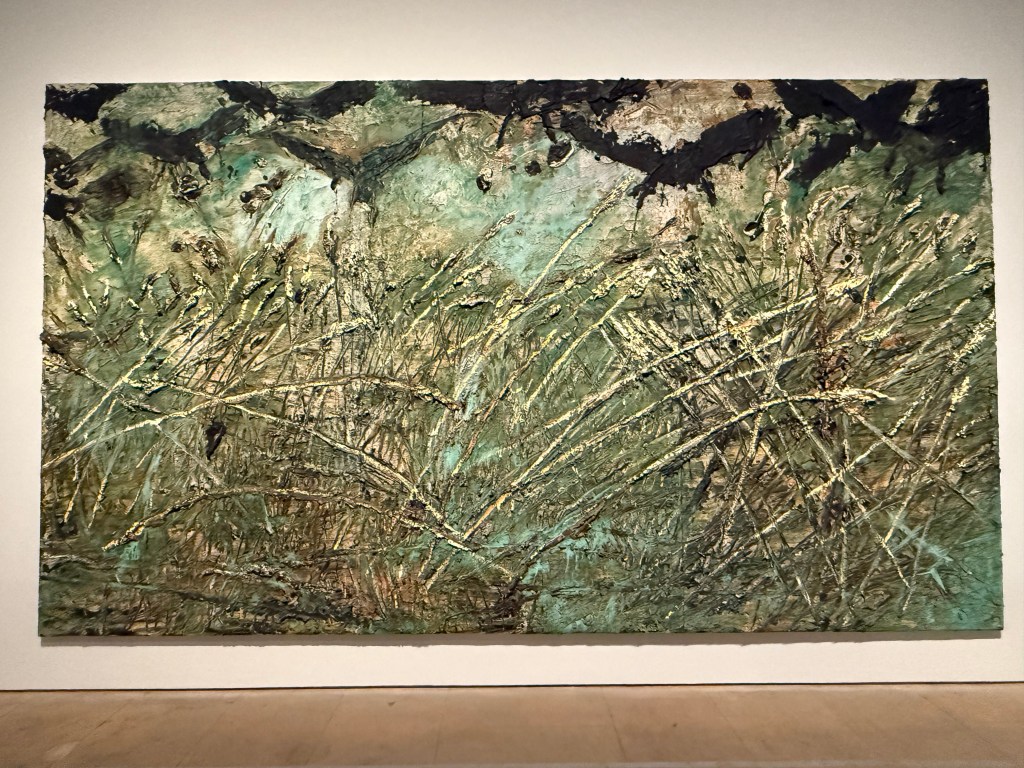
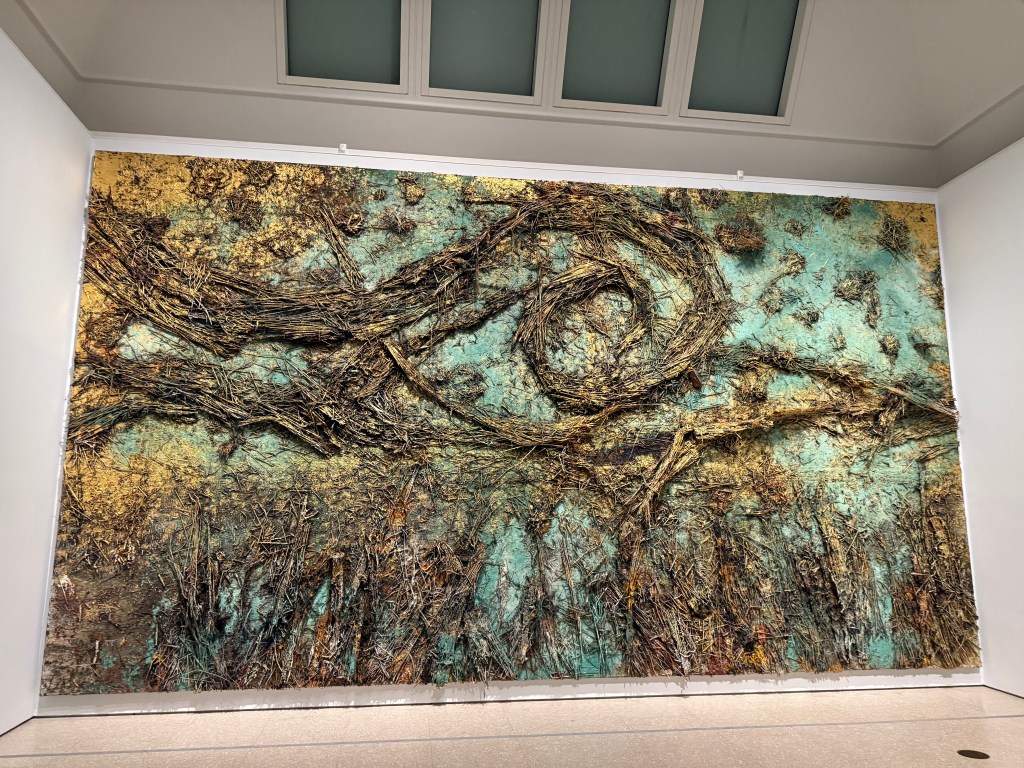
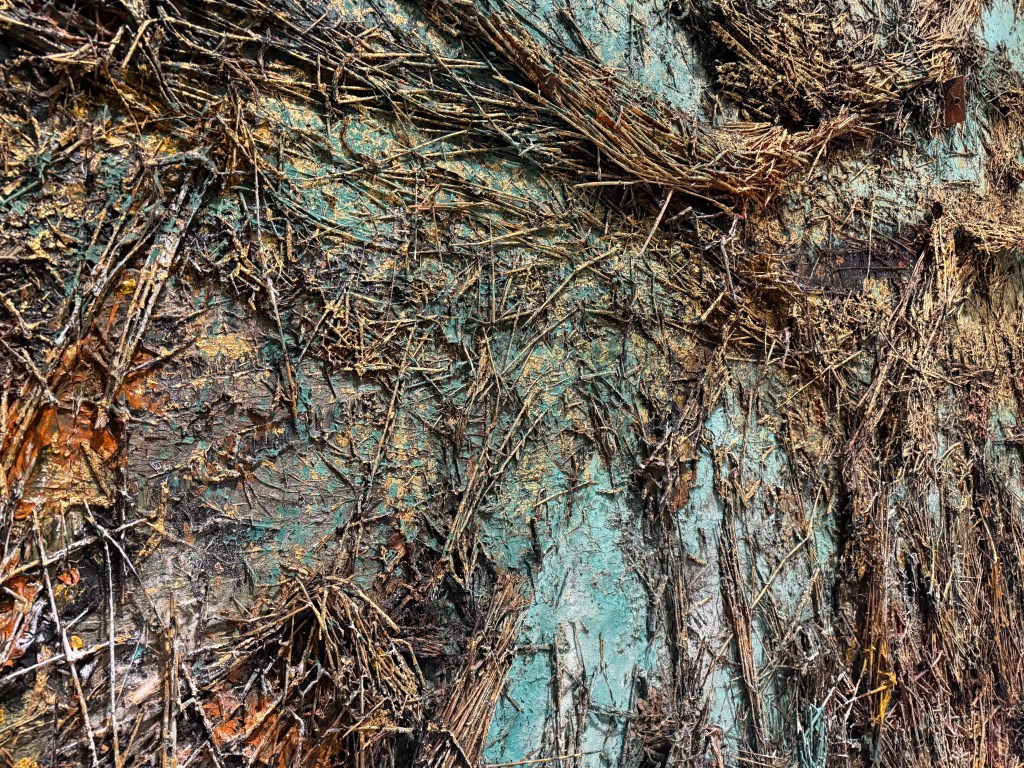
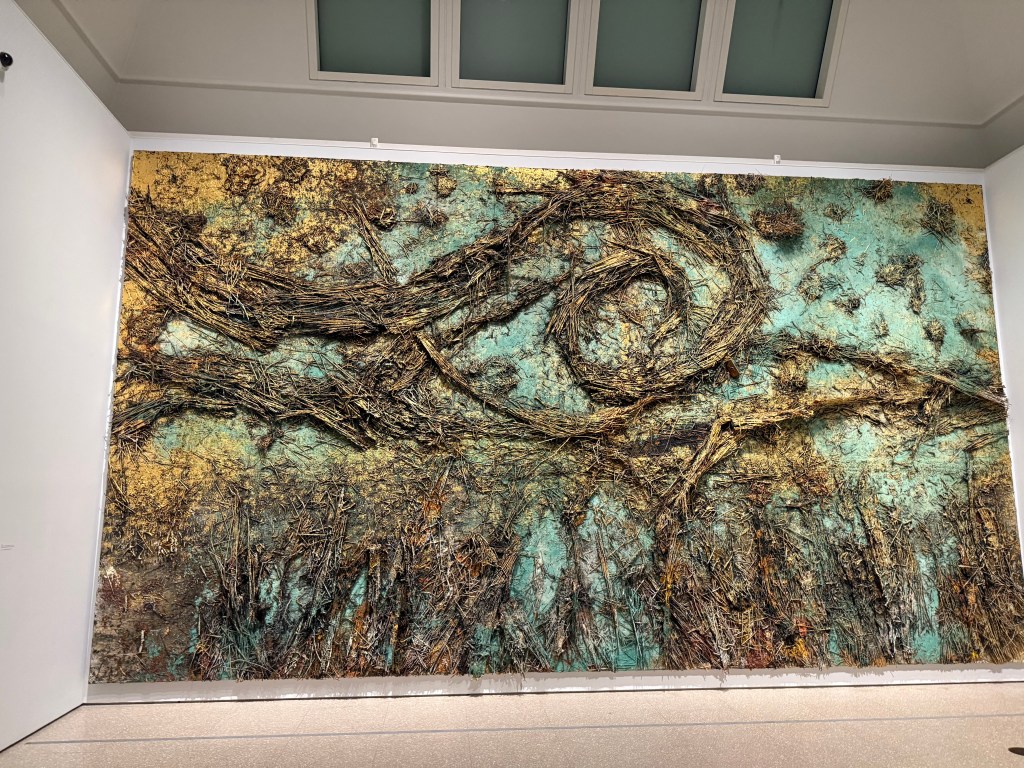
We then discussed Raita Bitless, and how Jonathan felt that there are some very important elements which are emerging and this is one of them. It feels like these are important memories which need to be explored further, and I agreed, explaining that sometime over the next couple of months I want to go back up to the Midlands and spend some time just wandering and reliving.

I’m sure that some of these discussions were prompted by a question, but the only one I can vaguely remember is when Jonathan asked me whether I was missing anything or needed anything more. I said that I didn’t think so, that I am quite happy just doing what I am doing. I have realised a lot about myself and the way I work (or not) – I had been attempting to squeeze the round me into a square hole. As such, I have effectively torn up my work plan, as it’s just not who I am, and have decided just to wander; to go on a dérive, and to wonder. Jonathan liked the idea of wondering whilst wandering – there’s a name for it, he said. I thought of it afterwards – a homophone – although apparently wonder and wander are not actually homophones because of a very subtle difference in pronunciation of the first syllable – what killjoys! I like it anyway, and there is a lovely interplay between the two.

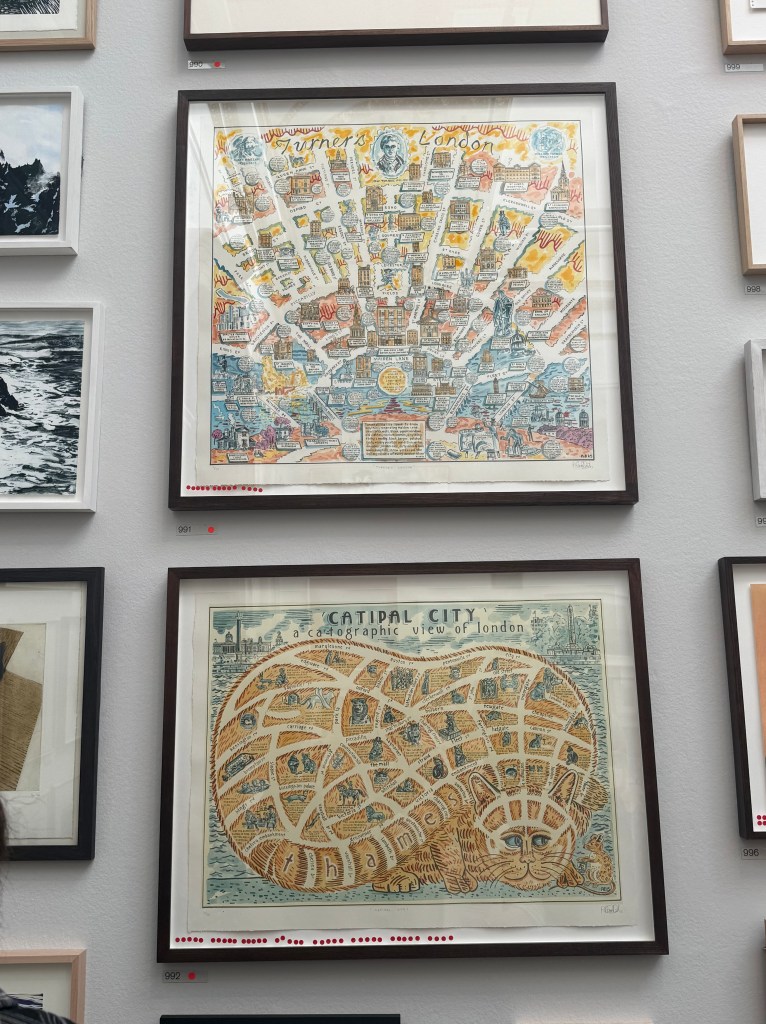
We then got onto the subject of the research paper and he referred to The Paradox Of Choice. I told him that I felt as if I had been told to go out and buy something, anything; that I had decided that I wanted to buy a cake but that I couldn’t specify which cake I wanted until I had visited all the cake shops and seen all that was on offer. I would have responded much better to having been given a choice of topic out of a small selection, akin to an exam paper; that I felt overwhelmed by choice and asking me what intrigues me doesn’t really narrow it down at all. Anyway, because of where my current experiments have taken me, I have decided to think about maps particularly in an autobiographical sense. We then went on to discuss maps and the issues with them in terms of distortion both physically in respect of projections and political motivations, perspective etc. Jonathan also mentioned Professor Steve Peters – Jonathan had been to a talk and had been given a copy of The Chimp Paradox – I had started reading it a while ago but didn’t finish it as I was probably distracted by something else. He referred specifically to the idea of the helicopter view. It’s a technique to gain perspective on something by imagining hovering over the issue in a helicopter which enables detachment and a more rational and objective view.

Does the need to do the research paper risk having a negative impact on my current wandering? This was a difficult question to answer, but on the whole I don’t think so – I’ve already recognised that I am a person of extremes, either really tidy or messy, focussed or distracted, honed in on the detail or preferring the bigger picture – each will appeal to my polar opposite needs and I am optimistic that what I discover whilst writing the research paper will have significant impact on my current practice.

I hope that I have covered everything we discussed although we must have talked about carbon paper at some point because I have used it recently. I have done a few things recently – I need to include them in a post but, frankly, all I have wanted to do is to make and not necessarily reflect on and write about it.